Reading the Shapes
Machine-vision algorithm improves 3-D modeling
Structured-light techniques using laser and camera-based systems are often used to extract depth information from parts under test. To build a three-dimensional (3-D) profile of these parts, laser line illumination is projected onto the part and the reflected laser profile captured by a high-speed CMOS camera. Image data are then read from the camera and the point cloud data used to reconstruct a 3-D model of the part. While these systems are often used to reverse-engineer existing parts, they have also found widespread use in pharmaceutical and automotive applications. Just two years ago, Comovia Group demonstrated how, using a smart camera from Automation Technology, the technology could be used for high-speed tire inspection (seeVision Systems Design, February 2006, p. 31).
“One of the most important aspects of designing an accurate structured-light-based system,” says Josep Forest, technical director at AQSENSE, “is determining the center of the reflected Gaussian curve from each point of the reflected laser line profile.” A number of different techniques can be used to do this, including detecting the peak pixel intensity across the laser line (resulting in pixel accuracy) or determining a threshold of the Gaussian and computing an average (resulting in subpixel accuracy). In the camera developed by Automation Technology, a more computationally expensive approach samples multiple points along the laser line and determines the center of gravity (COG) of the Gaussian curve.
“To date, this has been the most widely known and used method of determining the center point of the Gaussian, within the machine-vision community,” says Forest. AQSENSE, a spin-off from the University of Girona, is about to propose an improvement with a newly developed method that is claimed to be more accurate than COG methods. “In materials that exhibit some level of transparency,” says Forest, “light propagation from the inside of the material results in Gaussian profiles that are not completely symmetrical.” Especially in such cases, methods such as peak pixel detection, thresholding, and COG analysis may not accurately determine the peak position of the profile.
To overcome this, Forest and his colleagues have developed a simple, yet elegant, solution. “Our purpose is to identify the point of maximum intensity of the Gaussian. Using nonlinear interpolation techniques, up to 64x more pixel values within the ones forming the Gaussian can be inserted, and, therefore, a better estimate of the maximum intensity point can be obtained,” says Forest (see Fig. 1 on p. 7).
“However, because noise is present, the operation cannot be performed in every situation unless filtering is performed as part of the interpolation process. By adjusting finite impulse response (FIR) filters for a given type of material,” continues Forest, “different surfaces with different optical properties and noise levels can be digitized with a more accurate numerical peak detector.”
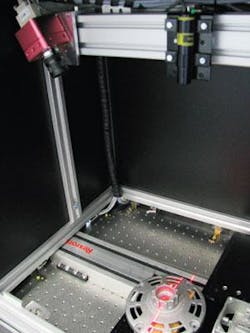
At Vision 2007 in Stuttgart, Germany, AQSENSE privately demonstrated the technology to a panel of machine-vision experts. In the demonstration, an MV1024/80CL 1024 × 1024 CMOS camera from Photon-focus was used to capture reflected light from a structured laser light from StockerYale (see Fig. 2). Captured images from the camera were transferred over a Camera Link interface to a host computer using a PROCStar II frame grabber fitted with a Camera Link interface board from Gidel.
“Because the PROCStar II features a Stratix II FPGA and is offered with a developer’s kit that includes the Altera Quartus II FPGA development tools,” says Forest, “the peak detector and cloud-point reconstruction algorithms could be embedded within the FPGA, although the peak detector design fits in much smaller and simpler FPGAs.” The resulting data were then displayed on the system’s host PC.
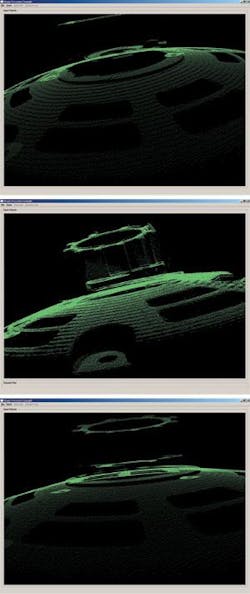
To compare the results of such cloud point reconstruction, the effects of scanning a machine part using a simple peak detection algorithm with no subpixel accuracy, an image generated using the COG approach and the algorithm developed by AQSENSE were compared. While simple peak detection results in aliasing effects, the effects of a COG approach show some improvement and that of the AQSENSE method results in the most accurate model (see Fig. 3). To promote the use of the technology, AQSENSE also announced that the algorithm can now be ordered as an option for Photonfocus’ latest 1024 × 1024 CMOS Camera Link camera that incorporates a Xilinx-based FPGA.
In addition, the company will soon roll out its Shape Processor software, a C++ application programming interface that allows dense 3-D clouds of points generated by any 3-D acquisition means to be aligned and compared. Based on a best-fit approach, the alignment software procedure includes source code examples, binary GUIs, and sample 3-D point clouds.
Using this software, 3-D models of scanned images can be compared with known good models. To compare both surfaces, it is necessary that they are accurately aligned, so then the comparison is done as a subtraction of both surfaces. However, in the production line it is very difficult to ensure that all objects are scanned in the same position and orientation. Usually, very expensive and complex mechanisms are used to fix the position of the object to the desired accuracy.
On the other hand, a mathematical alignment can be performed to compute the misalignment, in six degrees of freedom, between both surfaces. In general, mathematic alignment of 3-D clouds of points is complex and slow, so, not applicable on a production line.
Faster alignment
AQSENSE accelerates this alignment to fit the production line requirements. Based on an improvement of the best-fit algorithm, the alignment is performed in few milliseconds, depending on the initial misalignment between both surfaces. After that, a disparity map is generated by subtracting both aligned surfaces. The required time for this operation is linear with the number of points, that is, subtracting two surfaces of 1 million points each in a Pentium IV Core Duo 2 1.8 GHz takes 200 ms.
The software automatically detects the number of CPU cores to decrease the computation time by using all the machine’s computation power. In the case of important defects on the scan (broken/missing parts or big discrepancy with respect to the model), alignment accuracy is not affected, as long as the overlapping areas sum at least 50% of the object.
If proper 3-D calibration of the acquisition system is available, accurate 3-D measurements can be performed. However, surface inspection can be undertaken without acquisition calibration, highlighting object’s defects.
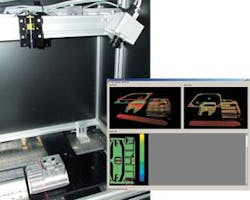
AQSENSE also demonstrated this technology using a C3-1280 3-D camera from Automation Technology. The setup for this demonstration included a structured laser light from StockerYale, as well as a linear motorized stage from Bosch Rexroth (see Fig. 4).
“As can be seen,” says Forest, “the parts are misaligned and must be properly registered for the operator to discern any difference between them.” To do this, Shape Processor software is used to generate a disparity map between the two. In this manner the differences between the two parts become apparent. “By performing this analysis (alignment + surface differences) in less than 300 ms,” says Forest, “inspection automation systems can more quickly pick out parts that may be defective.”
null


