Testing Lighting Products
Javier Oliver, Antonio Gutiérrez, and Elena Sanjuán
Manufacturers of lighting and illumination products often issue diagrams and tables that describe their lighting products. The optical properties of these products can be determined by the directional distribution of luminous intensity, color temperature, and chromatic coordinates. These parameters become critical for system integrators seeking to incorporate OEM lighting products into machine-vision systems.
According to the UNE-EN 60598-1 standard, a lighting device distributes, filters, or transforms light emitted by one or several lamps and gathers all the material to support, protect, and provide power. To quantify the performance of such devices, lighting manufacturers must invest in equipment such as spectroradiometers and luxometers, or contract specialized laboratories that use this equipment. In either case, the tests become significantly expensive when many different lighting products must be characterized.
To reduce the cost of production, AIDO has designed and developed a system for DCM Sistemes (Valencia, Spain; www.dcmsistemes.com) called the DCM-lux that allows these measurements to be made automatically. DCM-lux calculates the isolux maps, the illuminance cone, aperture angle, illuminance-vs.-light working distance, color temperature, and the chromatic coordinates used to characterize the lighting products.
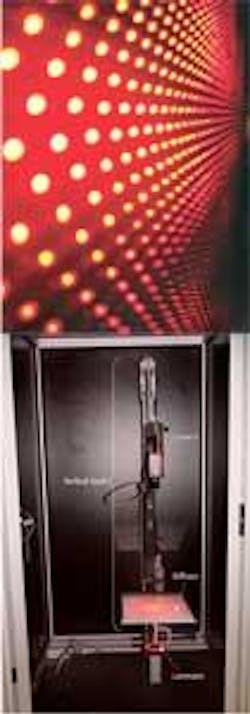
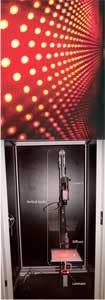
In the design of the system, a 1 × 1 × 2-m anodized box integrates a vertical, fixed structure that houses a color camera that faces downward at a diffuser plane (see Fig. 1). Lighting products are fixed at the base of the box, facing upward so as to cast light onto the diffuse surface. The camera then captures the light distributed on the diffuser.
null
Solid specs
The system comprises a Pike F-032C color camera from Allied Vision Technologies (AVT; Stadtroda, Germany; www.alliedvisiontec.com) and f/1.4–8-mm optics. The acquisition is performed using a Meteor II 1394 frame grabber from Matrox Imaging (Dorval, QC, Canada; www.matrox.com/imaging).
The camera provides an appropriate spectral response with a maximal resolution of 16 bits per channel and pixel that guarantees an accurate acquisition for visible, infrared, and ultraviolet wavelengths. (See Fig. 2.)
The application has been developed in Visual C++ .NET using Microsoft MFC. Matrox Imaging MIL8 libraries have been used to handle the image processing and data acquisition.
Different modes
Two different modes characterize the operation of the system. These extract the isolux curves for horizontal planes and compute the illuminance as it varies over the light’s working distance. Isolux maps show a map of where the illumination is constant. These isolux maps are computed from the luminance projected onto the diffuser surface.
In operation, the camera captures the light distribution on this plane, and then the system applies an empirical calibration formula and transforms the data to the illuminance space. This light can be measured in different units.
For illumination products that emit light in the visible range, the illuminance maps (measured in lux) are computed. For those that emit radiation in the ultraviolet and infrared spectrum, irradiance maps are used. These maps are then used to provide a brightness distribution of the image. Then, the illuminance cone, aperture angle, color temperature, and chromatic coordinates (CIE 1931) are calculated from the isolux maps and are displayed in a text format.
Illuminance vs. distance curves are representations of the illuminance in the central point of the map vs. the light working distance (defined as the distance between the light and the diffuser plane). These curves can be used to analyze the decaying of illumination for a fixed point, which is not typically used in most off-the-shelf evaluation systems. Although lighting systems are not commonly evaluated in near field, understanding this behavior may be useful for certain applications (see Fig. 3).
Comparing lights
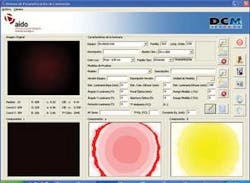
The DCM-lux system displays a description of the illumination system and the most significant parameters (see Fig. 4). In operation, the system allows an operator to configure and position the camera and the diffuser, set a description of the lighting, and perform testing to generate the isolux maps and 1-D brightness distribution tests.
After specific lighting parameters such as the name of the device, its topology, and wavelength are set, the user centers the light and sets a suitable combination of shutter and gain. This permits the system to visualize the device under test and allows illumination at the furthest working distance to be computed. To generate an isolux map, the user provides the measurement unit and the lamp’s working distance. For the 1-D brightness distribution, working distance range must be set. After measurements are taken, results are displayed in graphical form. A summarized set of the main parameters are shown in the main menu.
The system has been calibrated to work as an illuminancimeter for lights emitting in the visible spectrum, as a radiometer for those emitting in UV and near-IR range, and as a luminancimeter for backlights. To accomplish this, the CCD image sensor in the camera acts a matrix of reduced luxometers, which allows a relationship between the camera luminance and the illuminance that a luminancimeter would measure to be determined.
To obtain an accurate calibration, lighting parameters such as emission power, working distance, and wavelength, and camera parameters such as shutter, gain, and lens distortion have been analyzed. As result, the system allows any configuration of camera-lighting products to be analyzed and measured.
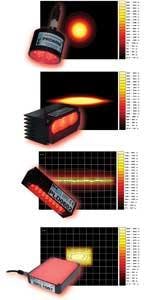
Isolux maps easily describe the light distribution from any lamp topology (see Fig. 5). Thus, in testing lights for DCM Sistemes, it is easy to see the high directivity of light for the PRD, the narrow light aperture angle of the PLC, the direct effect of the LEDs for a PLD in near field or the great light uniformity of a backlight.
Javier Oliver, Antonio Gutiérrez, and Elena Sanjuán are researchers at AIDO, Valencia, Spain; www.aido.es.
