Digital x-ray system images EPS foam
Custom x-ray radiography system provides images of low-mass, low-attenuation materials in two and three dimensions.
By Ronald Michaels
X-ray radiography technology can be used to characterize expanded polystyrene (EPS) foam as used in the lost-foam-casting (LFC) process. This equipment also can be used to image other low-mass, low-attenuation materials, including graphite, polypropylene, and polyvinyl chloride foams, as well as composites.
The LFC process is a relatively new casting technology that is experiencing widespread use. An EPS foam pattern is coated with a refractory material and surrounded by sand. When molten metal is poured into the pattern, the foam degrades and passes through the coating and into the sand. The metal solidifies, taking on the exact shape of the original foam pattern. The LFC process enjoys wide use in complex, thin-wall, near-net-shape nonferrous castings. For example, many General Motors engine blocks and heads as well as all currently manufactured outboard marine engines from Mercury Marine and Bombardier are cast using this process.
To model and control the LFC process it is necessary to characterize the structure of LFC patterns. Historically, this has been done using macroscopic measures of foam density and “fusion.” Industrial Analytics has custom-designed radiographic systems to allow local characterization of EPS foam and coating. This provides 2-D representations of the local density structure of the foam and information related to intrabead void fraction and interbead macroporosity. Coating measurements show coating thickness and interbead penetrations.
In addition to providing 2-D visual representations, methods developed by Industrial Analytics can combine multiple images for stereo viewing of an object, animated rotation, and time-lapse animation. These methods have been combined for stereo time lapse and stereo motion animations.
Experimental Setup
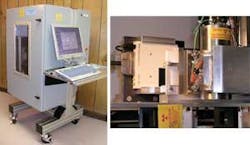
The custom x-ray system is a prototyping system designed for maximum configurability. The x-ray source is an Oxford Instruments Model XYTF5011 built for the 4- to 50-kVp energy range; it delivers up to 1-mA source current to a tungsten anode. A 60-mm focal spot allows modest magnification ratios without blurring of the image. The gantry fixture holds a section of EPS foam as used in the LFC process. Mounted behind this movable gantry is a Shad-o-Box 1024 digital x-ray camera made by Rad-icon Imaging (see Fig. 1).
The Shad-o-Box camera in the experimental system is rated for the 10-50-keV x-ray energy range and features a 1024 × 1024-pixel CMOS photodiode detector with 10-lp/mm resolution. Pixel size is 48 µm, for an overall sensor size of 49.4 × 49.4 mm. The photodiode array is mounted in close contact with a gadolinium oxysulfide (GdOS) scintillator screen that converts the incoming x-rays to visible light. The camera typically runs at anywhere from a few hundred milliseconds to several seconds of exposure time per frame, and several frames can be averaged together to reduce the x-ray shot noise.
The camera is controlled by a CyberOptics Semiconductor Imagenation PXD 1000 digital frame grabber, which is a PCI bus card that provides a 32-bit parallel connection to the camera. Included with the frame grabber are a function library and ViewPXD-a software application that allows viewing and storage of images. Rad-icon supplies its own sample software package for controlling the camera with this frame grabber.
The custom-built stage system is under full computer control, as are the x-ray source and camera. The sample stage allows for both horizontal and vertical movements of the sample. Samples up to 10 × 40 in. can be scanned in an automated sequence. A second-generation cabinet-model machine also includes a rotational stage that can acquire data sets for stereo animation and computed-tomography studies of various parts.
The large-frame scanner has custom-fabricated horizontal and vertical stages driven by stepper motors. The cabinet-model machine has a Velmex vertical linear stage and rotary stage. Oriental Motor USA Vexta stepper motors are powered by Applied Motion Products Model 235 stepper-motor drivers.
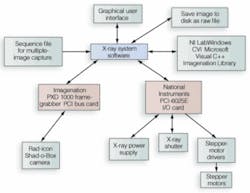
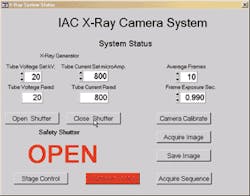
All machine functions are controlled through a National Instruments PCI-6025E multifunction I/O board. This board provides analog and digital I/O channels that control and monitor the x-ray generator, the shutter, and the stages. The multifunction I/O board and the frame grabber are controlled by software developed using National Instruments LabWindows/CVI software, and PCI bus cards are hosted by a PC running Microsoft Windows XP Home operating system (see Figs. 2 and 3). The systems are not networked.
The typical imaging conditions used to study the EPS foam samples are 15 kVp and 800 µA, with a frame exposure time of 4 s. A geometric magnification factor of 1.5 is used to obtain images, and ten frames are typically averaged together to reduce the photon shot noise in the images. Images are also routinely corrected on a pixel-by-pixel basis for camera gain and offset, as well as for variations in the uniformity of the x-ray beam.
System Calibration
Because of the combination of very low density (0.026 gm/cm3) and very low mass-attenuation coefficient for polystrene foam (2.088 cm2/gm at 10 keV), the imaging of EPS foam is a very challenging task. To provide more image contrast, conventional methods lower the energy of the x-ray beam by using a lower voltage across the x-ray generator. While the Oxford x-ray generator is rated down to 4 kVp, the tungsten target has spectral peaks in the 8- to 10-keV region that are at the specified 10-keV lower limit of the camera, so no improvement is possible this way. We elected to provide image enhancement by averaging over many frames-typically 10 frames-and by system calibration and correction on a pixel-by-pixel basis.
In a new experimental technique, the x-ray images themselves have been used to measure foam density on a pixel-by-pixel basis. This requires the calibration of every pixel by obtaining a calibration curve of mass per unit area vs. pixel reading.
First, the system response is calibrated by measuring a number of layers of polyethylene film under the same conditions as the EPS foam sample. The mass attenuation curves of polyethylene and polystyrene are nearly identical, and the mass per unit area of the polyethylene film samples is easily measured. The mass per unit area of the EPS foam along the x-ray path seen by a particular pixel can thus be read off the calibration curve. The density along the same path can be obtained simply by dividing the result by the thickness of the foam sample.
The simplicity of this technique stems from the fact that the calibration automatically compensates for the polychromaticity of the x-ray source and the response nonlinearities in the detector. Pixel-to-pixel variations in response, as well as angle effects due to the large active area of the detector, are automatically taken into account by performing the calibration for each individual pixel.
An equivalent mass attenuation coefficient (MAC) of 2.6 cm2/g is obtained from these measurements. This corresponds to the actual MAC of polyethylene at 9 keV, confirming that the density calibrations are in the correct range. Using this calibration method, the average foam density obtained for a sample test plate was 0.026 g/cm3, with a standard deviation of 0.004 g/cm3. Most of this deviation is due to the differences in actual measured EPS foam density from place to place in the sample.
The resulting images have a gray-scale range of approximately 100 to 200 out of the camera’s range of 0 to 4095; this very narrow gray-scale range exaggerates small system drift and nonlinearity conditions that would be negligible in the imaging of more-dense objects. For capture of multiple images, it is necessary to allow for sufficient warm-up time (on the order of one hour) and to carefully control the ambient temperature. While it is not possible to keep an x-ray generator running constantly because of regulatory and safety considerations, the Rad-icon cameras are kept powered up continuously.
Software calibration and other postprocessing steps have been developed in-house by Industrial Analytics using the open-source Scilab package (scilabsoft.inria.fr/) running under SuSE Linux on a PC. Image-format conversions and preparation of stereo images is done using the ImageMagick free software package (www.imagemagick.org). Since our company typically processes hundreds of images for a single project, all image manipulations are done using command-line software driven by shell scripts.
Foam Structure
When pre-expanded EPS beads are blown into a mold and fused with steam they deform into a complex 3-D structure. Adjacent beads expand and their surfaces deform into flat planes of denser material. When those dense flat planes are parallel to the x-ray beam, they form dark lines on the image. The amount of fusion between adjacent cells can be controlled by the steam time. As steam time is increased, bead expansion increases, creating larger planes with greater length and definition. Images from the test plates show dense inclusions as dark circular areas and foreign material as darker areas along bead boundaries.
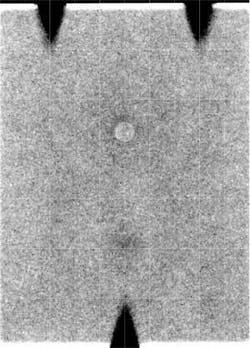
A standard EPS foam test plate, 150 × 200 mm, requires one hour for image capture and two hours for calibration, gray-scale enhancement, photomontage assembly of 35 images, and image-format conversion (see Fig. 4).
X-ray images can give qualitative feedback on local foam structure, and, with the proper calibration technique, these same images also can provide quantitative density measurements. A custom-built imaging system with full computer control of the x-ray source, the camera, and the sample stage is essential to carry out these experiments.
Acknowledgment
Portions of this work were carried out under US Department of Energy contracts DE-FC07-02ID14235 and DE-FG36-01GO11032.
Plant-root imaging
The need to image plant roots in situ has existed in the functional-genomics scientific community for many years. Most previous work has been done using conventional soil or very artificial growth conditions. Conventional soil substrates are not amenable to imaging of plant roots because of the similarity between plant-root properties and the surrounding soil materials.
Phenotype Screening Corp. (Seymour, TN, USA; www.phenotypescreening.com) has developed a novel method of imaging plant roots by growing the plants in a low-density, low-attenuation substrate. The plant and growth substrate are held in a low-density expanded polystyrene foam container that allows visualization of the plant roots in situ.
The primary tool is a modified, cabinet-model x-ray radiographic system developed by Industrial Analytics. In this design, an Oxford Instruments Apogee x-ray generator with a 35-mm spot size is combined with the Rad-icon Shad-o-box camera. A Velmex linear BiSlide with 15 in. of vertical movement and a Velmex Model B5990TS rotary table position the plant in its container. As with the Industrial Analytics large-frame scanner, all system functions are under computer control.
Current throughput of plants is about 4/h, which includes manually loading and unloading and manually starting the imaging sequence. Work is underway to develop an automated system that can image a plant-root system to provide images in about 1 min. With recent innovations in x-ray generators and cameras, both throughput and resolution will improve.
A simple motion-sequence description language controls vertical- and rotary-stage motions and time delays and provides unique file names to multiple images, all automatically. The unattended system can capture and save as many as 1000 images from one sequence file.
To assist in the interpretation of plant-root images, Phenotype Screening is now routinely taking stereo image pairs. The left image is taken by rotating the plant in its container slightly to the right; the image is then rotated to the left for the right image. The images are combined using the ImageMagick software package to produce a red/cyan stereo image that must be viewed through red/cyan glasses to see the 3-D effect. A pair of these glasses can be obtained by contacting Phenotype Screening via its Web site. - R. M.
Company Info
Applied Motion Products,
Watsonville, CA, USA
www.applied-motion.com
CyberOptics Semiconductor,
Beaverton, OR, USA
www.imagenation.com
National Instruments,
Austin, TX, USA
www.ni.com
Oriental Motor USA,
Torrance, CA, USA
www.orientalmotor.com
Oxford Instruments,
Witney, UK
www.oxinst.com
Rad-icon Imaging,
Santa Clara, CA, USA
www.rad-icon.com
Velmex,
Bloomfield, NY, USA
www.velmex.com


