Vision tracks material fractures
Video camera, data acquisition, and motion analysis combine to test fracture toughness of composite materials.
By Al Murphy
Testing fracture toughness in material structures-specifically composite laminates-has historically been the realm of microscopes and x-y chart recorders that monitor the crack growth and acquire force and deflection data for fracture-toughness testing. An operator views the delamination (crack growth) through a microscope as it progresses, then marks on the chart recorder when milestone increments in growth have been achieved. When the test is complete, force, deflection, and crack-growth data are reduced to provide fracture-toughness properties for the material under test.
This traditional approach does not provide real-time crack growth information or the ability to automate the testing process. To address these concerns, my company has developed a materials-test system that combines digital data acquisition and a video camera for recording applied force, crack opening displacement, and delamination growth. The system provides accurate data acquisition with minimal operator interaction once the test has been started and provides an accurate, nearly real-time representation of interlaminar fracture toughness.
Monitoring Delamination
Fracture-toughness testing of composite laminates to determine resistance to delamination requires applying force to a test sample containing a mid-plane release ply that serves to initiate the delamination. Force is applied to the test sample at a constant deflection rate described in ASTM (American Society for Testing and Materials) specification D5528, Standard Test Method for Mode I Interlaminar Fracture Toughness of Unidirectional Fiber-Reinforced Polymer Matrix Composites.
The ASTM standard requires force and crack-opening displacement to be recorded on an x-y recorder, a similar device, or a digital data recorder. The specification also calls for monitoring the crack growth with a microscope “or equivalent magnifying device” capable of resolving the delamination tip within ±0.5 mm. Crack-growth increments must be recorded within an accuracy of ±0.5 mm.
Since the tip of the delamination is moving continuously during the test as the crack-growth progresses, it becomes difficult to accurately measure growth of the delamination. The operator conducting the test must monitor the crack growth with the microscope and then look away to make a mark on the recorded trace when the delamination length increases by approximately 1 mm for the first 5 mm and then every 5 mm thereafter until the delamination has grown to approximately 50 mm. After each crack-growth increment is recorded, the operator must go back to the microscope, find the tip of the delamination again, and wait for the next crack-growth increment to repeat the process until the delamination has grown to the required length. The operator must also move the microscope, possibly several times during the test when the tip of the delamination moves outside the field of view.
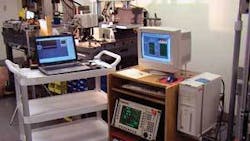
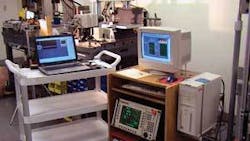
The vision system that we have developed uses a digital video camera as the recording device, allowing very precise location of the delamination tip for each frame of video-in effect, providing a nearly real-time recording of delamination length (see Fig. 1). Recording force and crack-opening displacement data with a digital data-acquisition system provides an accurate means of recording these data in real time. If force and crack-opening displacement are recorded at the frame rate of the video camera or an exact multiple of the camera’s frame rate, the force, crack-opening displacement, and delamination length data can be synchronized. The result is a highly accurate, effectively real-time representation of interlaminar fracture toughness.
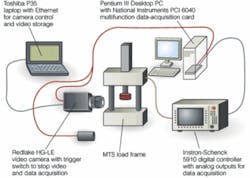
Our system was tested at Easton-Bell Sports test labs. It consists of an MTS Systems 858 tabletop load frame capable of exerting 3300-lb force in either tension or compression. Force is applied to the test sample by attaching load blocks with adhesive. The load blocks are connected to the test system with pin and clevis fixtures. A strain gauge bridge load cell connected to the end of the frame’s hydraulic actuator measures force, and displacement is measured with a linear variable displacement transducer (LVDT) mounted internally in the hydraulic actuator. Load frame force and displacement are controlled using an Instron-Schenck model 5910 digital controller.
Command signals are sent to the load frame’s hydraulic servovalve causing the hydraulic actuator to apply force. Force and displacement feedback signals are sent to the controller with displacement closing the control loop. Analog outputs are available from the controller, providing force and displacement signals to the data-acquisition system. The controller displays a digital readout of force and displacement in real time enabling the operator to monitor the test in progress (see Fig. 2).
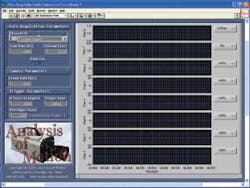
Data acquisition is implemented using a PC with a National Instruments (NI) PCI MIO 16E-4 (PCI 6040) multifunction data-acquisition card. Force and displacement data from the controller analog outputs are acquired at a scan rate equal to or an exact multiple of the frame rate of the video camera: in this case 25 Hz. Data-acquisition software is written in NI’s LabView software (see Fig. 3). Data acquisition is synchronized with the camera video by using the camera trigger switch to simultaneously terminate video capture and data acquisition.
When the trigger switch is pressed the camera stops recording video, and all frames before the trigger event are maintained in the camera’s internal memory. The trigger switch is also connected to a programmable input on the data-acquisition board to terminate data acquisition. Acquired data are stored on the hard disk drive as they are acquired. Since the video and data acquisition are both terminated at the same time (within one video frame), the data and video are synchronized within 1/25 s or less if a faster video frame rate and data acquisition rate are chosen. For this application, 1/25 s provides more than adequate resolution of crack-growth events, and camera memory capacity allows approximately 2 min of video to be stored.
The video camera used for this application is a Redlake MotionXtra HG-LE, capable of recording video at frame rates from 25 frames/s up to 100,000 frames/s at reduced resolution. Maximum video resolution is 752 × 1128 pixels at 1000 frames/s with reduced resolution at higher frame rates. The camera is fitted with a Tamron 28- to 75-mm macro zoom lens to permit close-up focus on the test sample.
The edge of the test sample is painted white to help distinguish the tip of the delamination, and a scale with 1-mm increments is attached below the mid-plane to provide a reference for delamination length measurement. Any video camera with known frame rate, adequate video resolution, ability to accommodate lens requirements, sufficient video storage capacity and ability to export video in digital format would work equally well for this application.
Motion Analysis
Motion analysis using ProAnalyst by Xcitex, in conjunction with digital data acquisition and video, provides a unique method for producing very accurate delamination growth measurements. A calibration reference is set using the scale attached to the edge of the test sample defining measurements in engineering units, and delamination tip position is measured with respect to a reference line established at the front edge. Manual tracking is used, since the small size of the sharp delamination tip and low contrast with the white painted edge of the sample makes automatic tracking impractical.
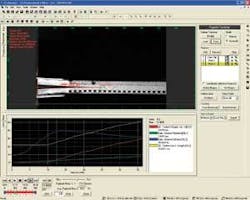
The reference line is defined with two track points set on a vertical axis and spaced on either side of the test sample mid-plane. Delamination tip location is marked with a third track point. Using the distance-to-line function, ProAnalyst draws a line normal to the reference line to the delamination tip and provides a measurement of the distance in pixels or calibrated units (see Fig. 4). This process is repeated for every increment of delamination growth measurement, in this case, approximately every millimeter.
If desired, delamination length could be measured for every video frame, providing a nearly real-time representation of delamination growth. Distance-to-line measurements with ProAnalyst accommodate movement of the test sample due to applied force. Since the reference line is tracked at the front edge of the test sample for each frame measured, the sample movement is compensated for, increasing the accuracy of the measurement. Subpixel accuracy in ProAnalyst measurements permit delamination growth measurement accuracy to within 0.007 mm for this example, compared with ±0.5 mm called out in the ASTM specification.
Ability to synchronize the force and crack-opening displacement data with the video completes the process, allowing nearly real-time representation of the test for processing and reducing data. Force and crack-opening displacement data stored in a text file on the data-acquisition PC are processed prior to importing into the analysis to provide proper synchronization. Since the start of data collection and video recording are not synchronized, the buffer contents of each will have a different number of video frames and data scans.
By extracting the same number of data scans (or the correct multiple if data acquisition occurs at a faster rate than the video frame rate) as there are video frames from the trigger event backward, the data will synchronize with the video when importing into ProAnalyst to within one video frame. Imported sensor data, applied force, and crack-opening displacement are plotted on the ProAnalyst graph along with crack tip position and delamination length calculated from the track points. Plots are smoothed using graph line filtering, in this case a mean filter with a half-width setting of 10. Graphed data are then exported to Microsoft Excel for further data reduction and analysis.
Combining a video camera, data-acquisition system, and motion analysis provides the ability to capture fracture toughness data and perform analysis with nearly real-time resolution. Using the video camera rather than a microscope and x-y recorder to monitor delamination progress permits the operator to perform the test with minimal interaction once the test is in progress, reducing the likelihood of mistakes. Because the video and sensor data are stored digitally, data reduction that would normally be a tedious process is quickly and easily performed using ProAnalyst for motion analysis and Microsoft Excel.
Al Murphy is principal at Analysis of Motion, Simi Valley, CA, USA; [email protected].
null
