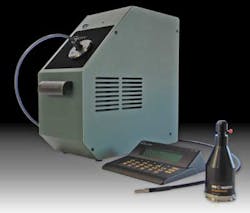
LEDs Light Up Fiber-Optic Systems
Andrew Wilson, Editor
The advent of high-brightness, long-life LED technology has had a significant impact on development of fiber-optic illumination systems, with numerous companies now offering light sources that use LEDs instead of halogen or metal halide lamps. While the expected life of halogen lamps is at most a few thousand hours and they can be replaced at relatively low cost, the increased lifetime of high-brightness LEDs—often greater than 50,000 hours—coupled with their compact designs has led to their rapid adoption in fiber-optic illuminators.
In conventional fiber-optic illuminators, the light output from halogen or metal halide lamps is transferred over a fiber-optic waveguide. This allows light to be transmitted to otherwise inaccessible places while eliminating the problem of heat being delivered to the object under inspection.
Technical specifications
To classify their illumination sources, manufacturers specify a number of different parameters that include the correlated color temperature (CCT), CIE color rendering index, wavelength of the emitted light, optical power at the output of the unit, and maximum illumination intensity at the light-guide index. When looking to replace halogen or metal halide-based light sources with LED-based systems, it is important to understand how these specifications compare.
Chromaticity of the color being emitted by light sources is described in terms of the light’s hue and saturation, regardless of its luminance. Many illumination system vendors specify the color temperature of the light emitted by their products. Color temperatures are described as units of absolute temperature. By comparing the chromaticity of a black-body radiator that radiates light of comparable hue to that of the light source, the color temperature of a light source can be determined.
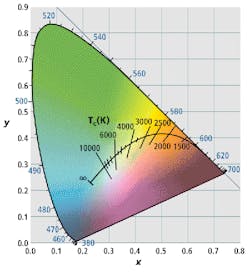
This color temperature is specified in units of Kelvin (K) and can be visualized on the CIE chromaticity diagram (see Fig. 1). However, because halogen, metal halide, and LED illuminators are not perfect black-body radiators, they are specified by their CCT. Also described on the Kelvin scale, CCT provides a value of the light’s chromaticity regardless of luminance along Planck’s radius in the chromaticity diagram. This provides a measure of the black-body temperature that best approximates the light source. Color temperatures greater than 5000 K are called cool; lower temperatures from 2700–3000 K are referred to as warm.
In developing LED-based illumination products, many manufacturers strive to reproduce a color temperature of 6000 K, which is the value most closely associated with daylight. The Fiber-Lite LMI-6000 LED fiber-optic illuminator from Dolan-Jenner, for example, features a color temp of 6000 K. However, halogen-based light sources exhibit a lower, warmer temperature of 3000 K, so randomly replacing a halogen-based illumination system with an LED-based light source may result in disastrous consequences in regard to achieving accurate color measurement for an object under test.
Color rendering
While the CCT provides a measure of chromaticity independent of luminance, the CIE color rendering index (CRI) shows how well the chromaticity values obtained by illuminating an object compare with illumination from a black-body radiator. To calculate this, CRI values can be derived from the spectral power distribution (SPD) of both the illuminant and eight color test samples specified by the CIE.
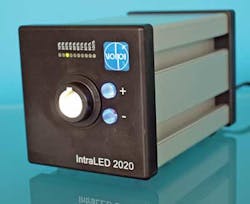
While perfect black-body reference sources will render CRIs of 100, other light sources such as 4200 K metal halide lamps may exhibit CRIs closer to 85. Together, both the CCT and the CRI values then show both the color temperature of the light and how faithfully color can be reproduced. In specifying these parameters for its IntraLED 2020 LED light source (see Fig. 2), Volpi indicates a typical CCT of 6500 K and a CRI of 80.
Once they understand both the CCT and CRI, potential buyers of LED illumination systems can properly compare these devices with their metal halide or halogen counterparts. Perhaps just as important, the intensity of the light produced by these systems can also be compared by carefully studying manufacturers’ data sheets. While some manufacturers tout their LED products as being “as bright or brighter” than metal halide- or halogen-based systems, a quantitative measure of the light intensity is properly measured as luminous power, which accurately describes the power of the light.
Light power
Luminous power, measured in lumens, is often specified by manufacturers of LED illumination sources at either the light source itself or at the end of a fiber bundle attached to the device. However, because this measurement is adjusted to reflect the varying sensitivity of the human eye, a more useful measurement is the luminous power (in watts), a figure that shows the total power of light emitted across the entire electromagnetic spectrum.
While this measurement allows luminous power to be compared among disparate systems, many manufacturers often use other measurements that include illuminance and luminous emittance. They provide a value of the amount of light incident to and emitted from a surface, respectively, and are measured in lumens/m2, which is a less meaningful measurement—that of luminous efficacy provides a value of the number of lumens that can be generated per watt.
Light output can be measured in a number of ways. Manufacturers often use one or another of these measurements in their data sheets. Meiji Techno, for example, specifies this light output as 780 lumens for the company’s FL-6000 LED fiber-optic illuminator while Dicon LED specifies an intensity of 2315 mW for its benchtop LED microscope illuminator, a product that can be tuned from 2700–7500 K.
Although the luminous output at the LED light source does provide a way to compare LED-based illuminators, it does not provide the system designer with a measure of how the system will perform when coupled to a fiber-optic light source. Coupling any general-purpose light source, for example, with a 5-mm fiber-optic bundle may result in a very different luminous power measurement than if a 10-mm fiber bundle is used. Only by measuring light output at the end of a specific fiber bundle can the system developer accurately determine how the light source and the coupling efficiency of the light/fiber combination will affect overall luminous output.
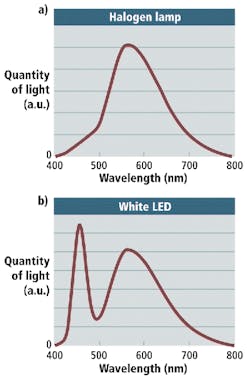
Luminous power of LED-based designs may be similar to halogen or metal halide illumination systems, but their spectral characteristics are very different (see Fig. 3). The halogen lamp exhibits an emission peak in the yellow range of visible light, but the quantity of light is reduced toward the blue and red range of the spectrum.
In many LED-based illumination sources, emission peaks occur in both the blue and yellow region. As can be seen, the emission peak in the blue range is the main differentiating factor between the spectral characteristics of LED and halogen sources. This difference can have a major impact when measuring the performance of a lens, since replacing a halogen light source with an LED source will cause a significant chromatic aberration of blue light. To overcome these limitations and allow LED illumination products to emulate their halogen-based counterparts, optical filters can be used to partially reduce the amount of light in the blue range of light emitted from the white LED.
Fluorescence microscopy
In applications such as fluorescence microscopy, specimens may be illuminated by light of specific wavelengths that is absorbed by a fluorescent molecule or fluorophore, which then emits light of a higher wavelength than the absorbed light. In the past, mercury and xenon lamp-based light sources were used to illuminate these samples. However, these required mechanical shutters and filters to deliver the correct amount of light for a specific time period and frequency. Furthermore, should a particular sample require multiple narrow-based illumination, filter cubes or wheels must be attached to the microscope.
Because of this, companies such as Zeiss and 89 North have LED-based illumination systems that eliminate the need for electromechanical shutters, color cubes, and filters. Zeiss’s Colibri system allows the user to choose from 10 LED modules that range from UV through to dark red and allow the operator to combine the spectral output of four individual modules at once (see “Light Pipes,” Vision Systems Design, April 2008).
Like the Colibri system, the Heliophor system from 89 North also allows a number of different spectral outputs to be simultaneously generated (see Fig. 4). Unlike Zeiss’s unit, however, the $10,000 (entry-level price) Heliophor system uses a number of modules with a UV LED light source to generate a number of different spectral frequencies, six of which can be installed in the system at any one time. By electronically shuttering the UV LED in the system, rise and fall exposure times as fast as 10 µs can be achieved.
In many machine-vision applications, it may only be necessary to illuminate the subject either with a broad white light or a single light with a narrow frequency. For this reason, The Nathaniel Group offers five types of LED-based illuminators in its SugarCube systems. While the white unit emits a broad spectrum, the colored units can be used to produce relatively narrow spectral bandwidths at 630 nm (red), 521 nm (green), and 458 nm (blue) (see “LED illuminators find microscopy applications,” Vision Systems Design, July 2009).
Company Info
89 North Burlington, VT, USAwww.89north.com
Dicon LED Richmond, CA, USA www.diconled.com
Meiji Techno Santa Clara, CA, USAwww.meijitechno.com
The Nathaniel Group Vergennes, VT, USA www.nathaniel.com
Volpi Auburn, NY, USA www.volpiusa.com
Carl Zeiss USA Maple Grove, MN, USA www.zeiss.com
