Cell Analyzer Spots Cancer in the Blood
Bahram Jalali
Automated microscopy systems are typically used in blood screening to identify tumor cells from a large population of healthy blood cells. Although the spatial resolution of CCD-camera-based systems enables them to resolve cellular structures in fine detail, the throughput of such microscopes is limited to imaging approximately 1000 cells/sec. Therefore, they cannot capture, analyze, and screen large populations of cells with a high statistical accuracy, so they are unable to detect rare abnormal cells.
Flow cytometry systems -- an alternative to automated microscopy systems -- can analyze particles at a higher throughput of 100,000 cells/sec. They can identify, separate, and isolate cells with specific properties -- such as cancer cells attached to fluorescent biomarkers -- after which cells can be manually inspected under a microscope.
Instead of producing an image of a cell, flow cytometry systems make an indirect inference about the structure of cells by analyzing the properties of laser light that is scattered from them. Thus, flow cytometry systems are unable to resolve single, multiple, clustered, or unusually shaped particles or cells, so they produce a large number of false positives.
To overcome the limitations of automated microscopy systems while improving on the throughput of flow cytometry systems, researchers at the University of California-Los Angeles (UCLA) have developed a tool that can capture images of cells in the blood and screen them for cancer at a throughput of 100,000 cells/sec with a record-low false positive rate of one in a million.
Imaging the flow
Because of the nature and sheer number of cells to be imaged at high speed, it was impossible for the UCLA team to use off-the-shelf cameras, illumination systems, or commercially available hardware and software.
Commercial cameras can capture images at up to 1 million frames/sec, but they must operate in a partial read-out mode to do so—a process that limits their resolution. Using powerful illumination systems to allow increased camera shutter speed is also unacceptable because doing so may damage or modify the cells.
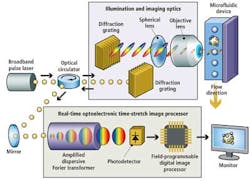
Instead, the UCLA Serial Time Encoded Amplified Microscopy (STEAM) flow analyzer employs a combination of optical time-stretching and image amplification with custom digital processing systems that acquire and then process and classify images of blood cells passing through a microfluidic device (see Fig. 1).
A broadband modelocked fiber laser creates narrow pulses of light that travel through a triple-ported optical circulator and impinge on a pair of diffraction gratings that produce and collimate pulsed spectra of light. The spectral pulses are then shaped by a series of spherical optical lenses to ensure that the pulsewidth matches the width of the microfluidic device channel onto which the spectra are focused by an objective lens.
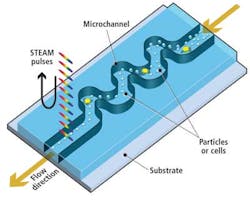
As healthy and cancerous blood cells tagged with biomarkers flow vertically through the microfluidic channel at a rate of 100,000 cells/sec, cross-sections of each cell are illuminated sequentially along the horizontal axis by a series of spectral pulses at a rate of one every 27 psec, effectively stopping their motion at a frame rate of 37 million frames/sec (see Fig. 2).
When the light pulses fall onto cross-sections through the cells, the amplitude of the reflected light in each part of the spectrum will vary according to the properties of the cell. For example, a dark cell wall will absorb more light and reflect less light than the fluid surrounding it.
Different frequency components (or colors) of the light in the spectrum illuminate various spatial coordinates along the horizontal cross-section of each cell. Thus, each frequency component of the reflected light also encodes these spatial coordinates.
Processing the pulses
Before the reflected optical spectral pulses from the cells can be processed digitally, they must be optically processed. This enables them to be sufficiently slowed such that the amplitude and spatial data encoded onto each of the wavelengths in the spectra can be converted into digital signals and the images of the cells reconstructed.
The reflected pulses travel back through the triple-ported optical circulator, which directs them to an optical element of a proprietary real-time optoelectronic time-stretch image processor. This optical element -- called an amplified dispersive Fourier transformer -- comprises a dispersive optical fiber through which the light spectra travel.
As each of the component parts of the spectra propagate through the fiber at different velocities according to their frequency, spectra that enter the fiber with a pulsewidth of 1 psec are stretched by a factor of around 20,000. This results in a spectra of light pulses with a pulsewidth of about 20 nsec. The time-stretch process slows down the image frames so they can be digitized and processed in real time by electronics that are otherwise too slow to handle such high-speed data.
Stretching the spectral pulses over time, however, diminishes the power of the original pulses. To resolve this and to amplify the image further, the weak optical signals are amplified during the time-stretching process by a few orders of magnitude before photon-to-electron conversion. This is achieved by pumping the fiber with a secondary laser that induces stimulated Raman amplification (see Fig. 3). The resulting image amplification allows the system to capture high-speed images without high-power illumination.
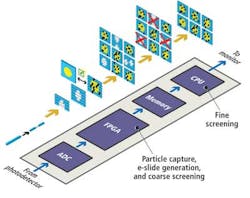
Sequences of stretched time-domain signals that appear at the output of the fiber are then converted into an analog electronic signal by a single-pixel photodetector. The signal is then sampled by an analog-to-digital converter (ADC) that converts the analog signal into a digital bitstream prior to being processed by a field-programmable gate array (FPGA) and a central processing unit (CPU) (see Fig. 4).
The time-stretched analog signals are sampled by the ADC at 7 Gsamples/sec, a high enough rate to enable an FPGA to reconstruct multiple 128 × 512 (scan direction × flow direction) pixel images of the cells as they flow at a rate of 100,000 cells/sec through the microfluidic device. The FPGA measures the amplitude of the reflected spectra to calculate what the intensity of each of the pixels in an image should be and uses the frequency data to infer the location of that pixel in the image.
Identifying the cells
To reduce the number of image frames that need to be analyzed by the system, the FPGA first performs a coarse screening of the images. It analyzes the image frames to determine whether they contain a particle or an empty space between the particles flowing in the microfluidic device channel.
Once the FPGA identifies the presence of an object in a frame, it calculates the size of the objects in the image frames, selecting objects that represent cells and saving them in the memory of the system and deleting those that represent debris such as unattached biomarkers.
The image of the cells stored in the memory is then screened by the CPU according to its circularity (shape), presence of clustering, and presence of biomarkers. An image library of different cell types (cancer cells, white blood cells, red blood cells, and other particles) was created from which the characteristic features of each cell type could be classified.
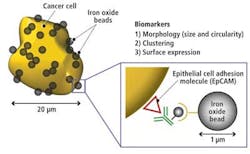
In analyzing the library of cells, it was determined that red blood cells typically have a 7-μm diameter and a donut shape, while white blood cells have a 10-to-15-μm diameter and spherical shape. Cancer cells, on the other hand, typically have a 15-to-30-μm diameter, an irregular or undefined shape, and tend to cluster together. They are also coated with biomarkers due to the fact that they express an EpCAM (epithelial cell adhesion molecule; see Fig. 5).
Having determined the characteristic features of the cells,Support Vector Machine (SVM) algorithms running on the CPU identify and classify these features. The system can identify one breast cancer cell in a million white blood cells at a throughput of 100,000 cells/sec with an efficiency of 75%. Less than 100% efficiency is achieved because the system misses small cancerous cells in the FPGA selection process and those cells not effectively coated by metallic beads.
Bahram Jalali is the Northrop-Grumman Optoelectronics Chair Professor of Electrical Engineering at the University of California-Los Angeles (UCLA; Los Angeles, CA, USA; www.ucla.edu).
STEAM advantages over conventional approaches
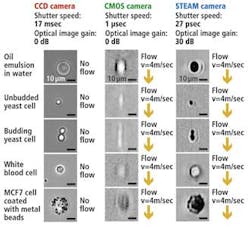
The UCLA STEAM flow analyzer has a number of notable advantages compared to traditional imaging systems that use either CCD or CMOS imagers (see figure).
With its 27-psec shutter speed, the STEAM camera can create 128 × 512-pixel images of cells as they pass through the microfluidic channel at a flow rate of 4 m/sec, a volume of flow that corresponds to a throughput of 100,000 cells/sec, while imaging cellular features down to about 1.5 μm in size.
To capture images at a similar flow rate, a CMOS camera with a shutter speed of 1 μsec would be required to operate in a partial read-out mode resulting in 32 × 32-pixel images being captured. Such images are not only low in resolution but suffer from motion blurring, whereas there is no blurring in the STEAM picture as a result of its ultrafast shutter speed.
Although CCD cameras are capable of capturing 1280 × 1024-pixel images with a comparable resolution to the STEAM camera, because of their 17-msec shutter speed they can only image stationary cells, rather than those moving at any speed through the microfluidic channel. The STEAM camera is nine orders of magnitude faster than systems based on a CCD camera; the systems share similar image quality due to the STEAM camera's optical image gain and ultrahigh shutter speed and frame rate.
Today, the high throughput of the UCLA STEAM flow analyzer is limited by the tolerance of the microfluidic device to the high pressures needed to create the high flow in the microfluidic channel, not by the image acquisition speed or the processing speed of the FPGA. In the future, the speed of the system will be increased to analyze 200,000 cells/sec. Reducing the wavelength of light used to image the cells by a factor of two will improve the image resolution further by a factor of four.


