Understanding distortion in machine vision lenses
Andrew Wilson, Editor
When specifying a lens to meet the demands of machine vision applications, systems developers must choose products that faithfully reproduce the object being imaged. To do so, machine vision lenses must be as free as possible from any possible image distortion effects. By understanding these effects and how they can be evaluated, designers can more accurately determine the types of lenses that will best meet the needs of their applications.
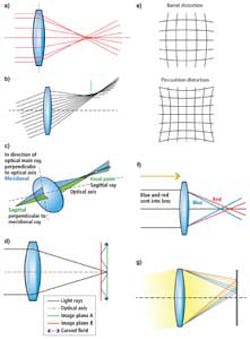
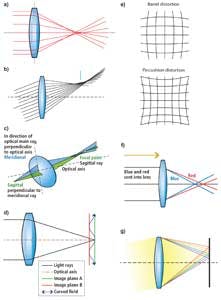
In 1857, Philipp Ludwig von Seidel described five types of lens aberrations: spherical aberration, coma, astigmatism, field curvature and distortion (Figure 1). Although these five Seidel aberrations occur when monochromatic light passes through a lens, axial and lateral chromatic aberration can also occur when polychromatic light is present. Although some form of aberration is present in every lens, manufacturers now offer lenses that minimize these effects.
Such distortion effects occur due to the way in which a lens is designed. In the simplest spherical lenses, for example, light travelling through edge of the lens will be focused more strongly than those that travel through the center of the lens. This results in a blurred image since all the rays are not focused perfectly, since the lens will image a point in the image as a spot not a point (Figure 1a).
To overcome this spherical aberration, multiple lens elements can be used. Alternatively, lens designers can alternatively opt to incorporate aspherical elements in their designs. In its Vari-Focal series of 1/3in format lenses, for example, Tamron (Commack, NY; http://tamron-usa.com) uses aspherical elements for this purpose. Unlike simple spherical lenses, the curvature of such aspheric lenses varies from the edge to the center thus reducing the effects of spherical distortion.
Light rays passing through points further from the optical axis of the lens will be refracted more closely than those closer to the axis in spherical lenses. Thus, light from off-axis point sources may appear distorted forming a larger image than the rays that pass through the axis of the lens. This aberration, known as coma, results in off-axis point sources appearing to have a teardrop or comet like appearance at the image plane (Figure 1b).
In combination, spherical abberations and coma distort light as it passes through the lens resulting in images that are irregularly shaped and/or blurred. To minimize these effects, aplanatic lenses that used multiple lens elements are required.
Just as light of a single wavelength will focus at different focal points, so too will light of different wavelengths. Chromatic aberration occurs because the refractive index of the lens varies slightly as a function of the wavelength. Since the refractive index is larger for blue light (short wavelengths) than red light (long wavelengths) different wavelengths will be focused at different focal points along the axis resulting in axial chromatic aberration (Figure 1f).
Axial chromatic aberration is not the only chromatic aberration that can occur. Since the magnification of the lens also changes with the wavelength of light, different wavelengths may also be focused at different points in the image plane (Figure 1g). This lateral chromatic aberration results in color fringes that occur in areas of high-contrast in the image. To reduce the effects of chromatic aberration, achromatic lenses are used. By using different types of lens elements that refract light at different intensities in the optical system, these acromatic lenses are designed to focus two wavelengths of light into the same plane.
To bring three wavelengths into focus at the same plane, apochromatic lenses often fabricated from three or more lens elements are required. In the design of its Apo-Rodagon-D apochromatic lenses designed for high-resolution machine vision applications, for example, Qioptiq (Fairport, NY; www.qioptiq.com) uses a six element design that reduces axial chromatic distortion and color fringing effects.
Choosing multiple element lens elements with different glass types can also reduce the effects of other aberrations such as astigmatism. Astigmatism results in rays of a horizontal and vertical orientation having different focal points (Figure 1c). Here, the difference in focal length, known as the astigmatic distance is used as a measure of the amount of astigmatism present in the lens.
Like astigmatism, the effect of field curvature in spherical lenses can also result in blurred images. This phenomenon occurs because the curved optical elements in the lens will image an object onto a curved surface. In such cases, the resulting image is not blurred, merely projected onto the curved surface. However, since the image plane in digital cameras is flat, captured images will be exhibit aberrations.
In a simple case, light rays may be focused in the center of the frame, but image sharpness will progressively decrease from the center of the lens. In real lenses, where multiple lens elements are used, the field curvature will often appear with wavy field curvature (Figure 1d). In this case, lenses may show sharp center and corner performance but not as sharp at other points.
Similarly, aberrations such as distortion do not blur the image but instead displace image points radially either toward or further from the optical axis. In barrel distortion, image magnification decreases with distance from the optical axis resulting in images that appear barrel shaped. If pincushion distortion is present in a lens, then image magnification increases with the distance from the optical axis resulting in points imaged at the periphery of the lens being bowed towards the center.
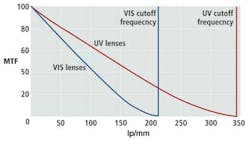
When specifying a lens for a particular vision system, designers should seek lenses with as little spherical aberration, coma, astigmatism, field curvature, distortion and chromatic distortion as possible. To understand how many of these aberrations affect the performance of a lens or lens system, the modulation transfer function of the lens can show how the lens performs. By providing a ratio of the image to object contrast (the modulus of the optical transfer function (or MTF), such charts are used to evaluate how the lens behaves as the spatial frequency of an object being imaged increases (Figure 2). Thus, as the spatial frequency increases, the MTF decreases. When the MTF reaches zero, the spatial frequency in line-pairs/mm provides a measure of the resolving power of the lens.
Lenses with spherical aberration and/or coma will introduce wavefront errors and degrade the performance of the lens. MTF plots can also chart the amount of astigmatism of a lens. To accomplish this, the MTF is measured along saggital (S) and tangential (T) lines from the center of the lens. This will result in two MTF plots in which the greater the distance between them, the larger the astigmatism (Figure 3).
In this chart, supplied by Steve Gum, Senior Optical Engineer at Navitar (Rochester, NY; www.navitar.com), the black line denotes the diffraction limit while the blue line shows the on-axis performance. This line does not split into "T" and "S" components because they are always equal on axis. The pair of green lines in the graph represent the MTF at 70% of full field. Here the lines split and the tangential focus is much improved over the saggital focus so the tangential MTF curve is higher than the saggital. The red line shows the full field position which is just a more extreme version of the 70% field. Here, the "S" red line is zero at 60lp/mm. This means that the contrast is zero at 60lp/mm and above. The fact that the line rises again beyond that point is what is called spurious resolution and is mostly a mathematical phenomenon and not real.
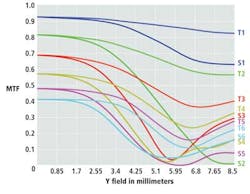
If MTF curves are plotted as a function of field position at particular spatial frequencies, such plots can also prove a valuable indication of the field curvature present in a lens. If wavy field curvature is present, for example, the MTF value will vary in a wavy manner from the center of the lens. This will result in an image that is sharper at different points from the center of the lens (Figure 4).
Although MTF charts may allow similar lenses from a single manufacturer to be compared, the different testing methods used by individual manufacturer makes it difficult to compare lenses from different vendors. Finally, since other factors such as filters, imaging sensors and camera readout electronics will also affect image quality, MTF charts should only be used as a starting point when comparing lenses.
Companies mentioned
Adept Turnkey
Warriewood, NSW, Australia
www.adept.net.au
Carl Zeiss
Oberkochen, Germany
http://corporate.zeiss.com
Edmund Optics
Barrington, NJ
www.edmundoptics.com
Melles Griot
Rochester, NY
www.cvimellesgriot.com/
Navitar
Rochester, NY
www.navitar.com
Qioptiq
Fairport, NY
www.qioptiq.com
Schneider Optics
Hauppauge, NY
www.schneideroptics.com
Tamron
Commack, NY
http://tamron-usa.com)
For more information, please visit the lenses section of the Vision Systems Design Buyer's Guide (http://bit.ly/1835RrP).
Further reading
"How to read MTF Curves"
by H.H. Nasse, Carl Zeiss (http://bit.ly/bhXw3y)
"Modulation Transfer Function",
Edmund Optics (http://bit.ly/16ZR93s)
"Optics distortion as applied to Machine Vision",
Adept Turnkey (http://bit.ly/11x09MF)
"Machine Vision Lens Fundamentals",
Melles Griot (http://bit.ly/11x1yD3)
"Fundamentals of Selecting a Lens",
Channel Systems (http://bit.ly/KxdJsY)
"Distortion"
by B. Hönlinger and H. H. Nasse, Carl Zeiss (http://bit.ly/4AViuX)
"Quality Criteria of Lenses",
Schneider Optics (http://bit.ly/11JGcOz)
"Astigmatism in Camera Lenses"
by Douglas A. Kerr (http://bit.ly/17u6i0m)
"Aplanats and Achromats"
by Emily Kubacki, CVI Laser (http://bit.ly/126d6Pi)
"Modulation Transfer Function"
by Bob Atkins (http://bit.ly/14lt07Z)
"Photographic Optics"
by Paul van Walree (http://bit.ly/biHFoB)
Vision Systems Articles Archives


