High-speed imaging / Research and development: Motion analysis software performs frequency analysis
Imagine filming a Jimi Hendrix solo with a high-speed camera. Without having any sound, the sheet music could be written using motion analysis software and the video of the strings. After all, notes are nothing more than sound waves produced by strings oscillating at a given frequency.
High-speed imaging involves the use of video cameras that record at a higher frame rate, and then play back at a slower frame rate allowing the human eye to observe and understand phenomenon usually too fast. Recording at hundreds or even thousands of frames per second, then playing back at a slower frame rate, may also be considered slow motion imaging to some.
Regardless, industrial and military companies throughout the world often find it necessary to capture sequences of high-speed images for analysis to help them have a better understanding of the phenomenon they are working with every day.
Automotive applications, for example, include analyzing the dynamics of airbag deployment, vibration of engine parts, deformation, crash tests and sled tests. Industrial and R&D applications use high speed imaging for material characterization, fatigue tests, injectors, and vibration analysis. Medical applications might include biomechanical analysis such as measuring heart valve frequency or impacts to the spinal column.
Defense applications include characterization of ammunition, measuring spatial repartition of fragments after explosions, and ballistics such as measuring the angle of flight, the penetration of bullets on different shaped objects, deformation of armor upon impact, or velocity of a bullet on ricochet.
While many of these applications involve analyzing images to measure trajectories, velocity, acceleration and other outputs from objects of interest, Image Systems (Linköping, Sweden; www.imagesystems.se) recently posted a YouTube video "TEMA Motion Analysis - Vibration of guitar strings" (see: http://bit.ly/VSD-TEMA).
The vibrating guitar strings are filmed with a Miro C210 Phantom camera from Vision Research (VRI; Wayne, NJ, USA; www.visionresearch.com) with halogen lighting and a 50mm lens at 2000 frames per second. "The purpose of the video is to illustrate the ability of our TEMA motion analysis software to track small vibrations of objects with accuracy and perform frequency analysis in various domains," explains Thomas Estruch, Application Engineer at Image Systems, and the creator of the video.
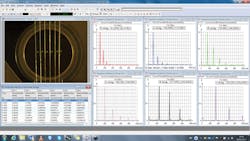
For this experiment, Estruch used a Yamaha guitar, and marked one small area of each string with black ink to create a contrasted pattern to track in the video sequence. A correlation algorithm is used to track the vibration of the six strings with subpixel accuracy. The software's algorithms automatically generate frequency graphs showing the main resonance of each string as well as harmonics.
In every diagram the standard tuning reference (E-A-D-G-B-E) for each guitar string is indicated in brackets as well as the measured tuning from the recorded guitar images. Results can be presented in tables and diagrams as shown in the video and can be also exported to create videos, reports or CSV/ASCII files.
"By analyzing the position of a particular area of each string on the video, the system is able to measure the frequency of oscillation and come back to the note that was played. Providing sound analysis based on only string movement is an interesting way of seeing music," notes Estruch. "It also illustrates how simple it is to perform shock and vibration analysis in industrial applications such as engines, springs, and injectors."


