Laser-light sensor directs robotic-vision weld positioning
Laser-light sensor directs robotic-vision weld positioning
In applications in which long seams are to be welded automatically by robotic machine-vision systems, the correct position of the welding torch relative to the seam is of prime importance. To ensure proper welding, Azure (Dorchester, Dorset, England) has developed a noncontact vision sensor to monitor the position of the seam relative to the welding torch and feed this information to the robotic position controller.
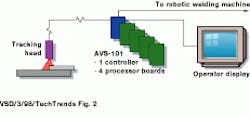
Based on the company`s AVS-101 multiprocessor architecture, the robotic system incorporates a tracking head that detects the edge of the upper plate on which to position the welding torch to achieve a consistent weld at the fastest possible speed.
During operation, the tracking head shines a thin line of laser light diagonally across the welding seam to create a shadow. A camera is positioned directly above the welding area so that the edge position of the upper plate can be seen by a gap in the line caused by the shadow. Having found the position of the gap, system software then determines the edge of the upper plate from the edges of the gap. Then, the offset from the welding torch`s actual position to its correct position is calculated and sent to the robotic position controller.
To increase welding speed, the AVS-101 uses multiple processors that run the machine-vision software in parallel. During operation, the robotic system first searches for the image of the laser line, processes this line for the gap, and finds the position of the edge of the weld plate. According to Azure, using two processors to search for the image of the laser line produces results up to twice as fast as using a single processor.
Satellite data processing analyzes El Niño weather effects
During the past few months, efforts at the National Environmental Satellite, Data, and Information Service (NESDIS; Suitland, MD) have been focused on the El Niño phenomenon, the name given to the cyclical warming trends of the Pacific Ocean near the equator. Increases in water warming occurs when the natural trade winds, which usually blow surface water toward the middle of the Pacific Ocean, diminish in intensity, thereby causing the stationary ocean water temperature to rise.
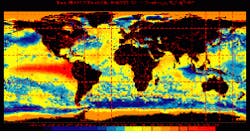
According to physical scientist Chris Duda, researchers at NESDIS are using the Interactive Data Language (IDL) from Research Systems (Boulder, CO) to interpret Advanced Very High Resolution Radiometer (AVHRR) satellite data. The results are then used to produce sea-surface temperature (SST) anomaly charts.
"Such SST charts are important to weather services for short- and long-term predictions of global weather patterns. They also provide operational support for meteorologists and oceanographers," says Duda. "In particular, the Hurricane Center is one of our big customers."
Accurate weather data help to predict when and where life-threatening weather will strike. In addition, monthly and yearly SST averages help researchers understand the dynamics and consequences of global weather patterns and phenomena such as El Niño.
Current data and readings show that the El Niño-influenced waters have warmed 5C above normal, higher than ever before recorded. Because the warmer El Niño water evaporates in greater amounts than normally cool water, some parts of the world have received extra moisture in the atmosphere during the El Niño years. This condition is causing more frequent and intense hurricanes for the tropics, more rain for the western seaboard of the United States, and more snow for the Rocky Mountains. Furthermore, some regions of the world have become drier than normal and have experienced droughts, which unfortunately lowers crop yields and produces forest fires.
IDL`s built-in data-processing algorithms give Duda and his colleagues the power to interpolate and filter the satellite data. Fourteen times each day, the AVHRR data are transmitted to Earth from geostationary and polar-orbiting satellites and are collected in an IBM mainframe computer. Twice weekly, the Environmental Products Group analyzes these readings. Using Hewlett-Packard computers, the IDL programs generate mapped images of SST anomalies.
"With IDL, we can obtain accurate climate averages at the desired grid points," comments Duda. IDL`s math routines provide the interpolation and mapping algorithms needed to process the SST observations and are also used to filter noise from the satellite data.
"Using the SST fields derived from the NOAA polar orbiting satellites, we can make near-real-time assessment of the anomalous warming associated with El Niño," says Duda. After data analysis, the SST charts produce averages and revealing anomalies.
Duda says, "IDL`s suite of customizable map projections give the Environmental Products Team the basis for generating updated charts within 12 hours after starting the data analysis. In the past, this process took at least a week. One of our goals is to produce as near to real-time anomaly analysis as possible."
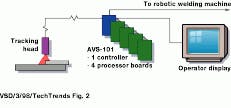
To speed the task of positioning a robotic welding system, weld-edge-detection algorithms are partitioned across multiple processors.
Advanced Very High Resolution Radiometer satellite data are processed and displayed in Interactive Data Language to produce sea-surface temperature anomaly charts. These charts are then used to analyze the weather patterns generated by the El Nino phenomena in the Pacific Ocean (data courtesy of NOAA/NESDIS).


