Vision speeds inspection of labels
Off-the-shelf components and custom software team up to inspect oral dosing devices.
By Sergey Khlebutin
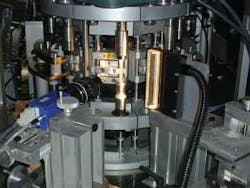
In the production of its plastic injection-molded oral dosing devices, Comar, a producer of a range of tubular glass vials, media tubes, plastic bottles, components, dropper assemblies, and oral/topical dispensers, needed to ensure that the detailed print wrapping around each device was accurate. Comar guarantees the quality of the print on the oral dosing devices by automatically inspecting each individual device with a PV-1000 Print Vision Inspection System developed for it by Ross Inspection Systems (see Fig. 1).
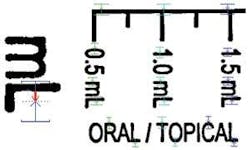
The dosing devices are produced in 3-, 5-, and 10-ml, with diameters ranging from 0.4 to 0.7 in. The print can wrap 360° around the device, and the length of the printed area can extend to the entire 2.75-in. length of the main body of the device. Multiple colors are available for both the device body and the print. For example, some devices have black print on a transparent surface, while others have white print on a dark-brown one. The print can consist of any combination of a measurement tree(s), text of various size, and font types and graphics such as company logos.
The system must inspect 100% of the print on every device at the rate of 150 ppm. It must be capable of finding print defects as small as 0.004 in. Highly critical features, such as the small decimal points in the dosage numbers, must be inspected with even higher precision. The system must verify location of measurement lines and must check paint contrast. Because new products are constantly being introduced, the system must be able to be easily taught to inspect new labels.
Front End
The devices are conveyed from the printing machine to a bowl feeder that sends them into a gravity-fed dispenser that places them into individual rotary fixtures on a rotating circular turret. As the turret rotates the devices toward the inspection station, the individual fixtures engage a high-speed belt that brings them up to a fixed and stable rotation speed by the time they reach the imaging station.
To image the part as it is rotated, a Dalsa Spyder 2k × 1 CCD linescan camera is coupled to a PC-based host using a Matrox Imaging Meteor II/DIG. The linescan camera creates an image of the object by rapidly acquiring single lines of image data while the part is being rotated and building a two-dimensional image one line at a time. This essentially unrolls the cylindrically printed pattern into a flat image.
Because of the high acquisition line rate, about 13k lines/s, a high-intensity light source focused to a small line was required. The systems uses a DCR-II halogen light source fiberoptically coupled to a 6-in. fiberoptic line light with a matching apertured focusing lens, all from Schott-Fostec.
Custom Software
Extrapolating published benchmarks from machine-vision software vendors indicated that standard search algorithms would not be able to find the label on such a big image (>4 Mbytes) in the allowed inspection time. Also, these libraries could not correct for distortion. Thus, a custom algorithm was necessary. Ross wrote an algorithm in C++, using the Matrox MIL-Lite library, to communicate only with the camera; the image-processing function does not use a standard library. It inspects a typical image for 185 ms running on a 1.0-GHz Pentium III industrial PC. The system could actually work twice as fast as the 150 parts/min requirement, but there are mechanical limitations preventing that.
The processing of each image captured by the PV-1000 is a variation of a golden template comparison, with the significant complication that the pattern has nonlinear distortions. Relative to the template, the pattern can be skewed, rotated, or elongated in some areas while compressed in other ones and/or can contain any combination of these distortions simultaneously. Even a worker cannot align a typical grabbed image with the template using shifting and rotation without retaining 10-30 pixels of misalignment in some areas of the image.
This distortion occurs for many reasons: inconsistent rotation speed during image capture and/or printing, rotation of the part around other than the precise center (runout), differences in the part shape due to the part being produced in a multicavity mold (often they are bent a little), and so forth. Due to these printing and imaging problems, the height of a character on the label of about 100 pixels can vary by 17 pixels on two similar parts; from the customer’s perspective this difference is acceptable as long as the individual characters can be read correctly. It is even possible that two images of the same part can have 10-15 pixels misaligned. The PV-1000 algorithm can compensate for all forms of image distortion while detecting 100% of the character defects.
The first step is to locate the label in the image. After receiving a trigger (part in place) signal, an image to be analyzed is captured and stored in RAM on a host PC. Because the trigger signal is not synchronized with a specific location on the rotating dosing device, two full rotations must be captured to ensure that there is a contiguous image of the 360° part. The algorithm uses the fact that the label always has a measurement tree and searches for long vertical lines that closely match the measurement tree by their lengths and relative locations.
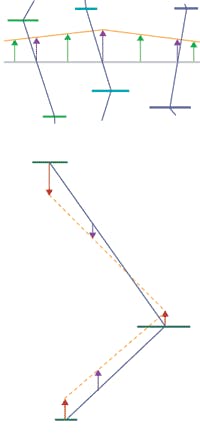
To correct any vertical distortion in the inspected pattern, the locations of selected horizontal edges defined in the template are compared to the corresponding edges in the image of the part being inspected. A rectangular area positioned on the golden template image known as a system “edge detector” indicates the location of the horizontal edge. The algorithm detects the location of the corresponding edges in the image being inspected and calculates the vertical shifts required to correct the distortion at each edge’s location (see Fig. 3). The algorithm uses three groups (chains) of edges-left, central, and right-but it could have any number of groups ≥2. With this vertical shift distortion calculated on the edges of all three groups, the algorithm then determines the shift for all pixels of the image (see Fig. 4).
The algorithm assumes the horizontal distortion in the image is relatively small compared to the vertical one. To correct for horizontal distortion, it divides captured images into rectangular cells (128 × 32 pixels) and attempts to achieve better alignment with the template by shifting each individual cell horizontally. First, the top row of cells is horizontally aligned while retaining the optimized shift information. For each cell of the next row, the algorithm first shifts by the same amount and then by one pixel to the right or left to ensure the best alignment.
After performing distortion correction on the inspected image and comparing it with the template pattern, a result of the difference is generated. Usually there is a thin layer of difference pixels around individual elements. These differences are eliminated by a user-specified number of erosions. In many cases, a single erosion erases the differences completely. However, if the print is a little thicker or thinner than the template (but still looking good for a consumer), two erosions may be necessary. After the erosions, only real defects remain.
If the erosions eliminate the difference pixels completely, then the image is characterized as good. However, in some cases, the user may want to accept a part even if there are some difference pixels retained after the erosions. To accommodate this, the algorithm performs blob analysis on any difference pixels left after the erosions by grouping them into connected groups and calculating their areas. The algorithm then rejects the image if there is either a blob bigger or the total area (or number) of all blobs is bigger than a user-specified parameter. The algorithm can also reject a part because of absence of or small size of a decimal point (they are separately checked), incorrect distance from a measurement line to the bottom of the part (to ensure the correct dosage will be administered), or if paint’s contrast is not within user-specified limits.
The system can be taught to inspect virtually any new label that Comar might introduce. To create a new template, the user has to capture an image of a golden part. Then the user specifies location of the measurement tree, edge detectors, decimal points (if any), and so forth, using a graphical editor supplied with the system. The label can be divided into regions with different inspection criteria.
Company Info
Comar,
Buena, NJ, USA
www.comar.com
Dalsa,
Waterloo, ON, Canada
www.dalsa.com
Matrox Imaging,
Dorval, QC, Canada
www.matrox.com/imaging
Ross Inspection Systems,
Nanuet, NY, USA
www.rossinspection.com
Schott-Fostec,
Elmsford, NY, USA
www.us.schott.com


