Automated 3-D imaging speeds firearms analysis
Vision system uses off-the-shelf imagers, frame grabbers, motion controllers, and positioning systems.
By Andrew Wilson, Editor
Microscopic striations on the surface of fired bullets and cartridge cases are routinely used to associate a bullet with a particular weapon. Such an association is possible because each weapon imprints unique striations on the surface of each bullet it fires. To determine a possible match between bullets fired from any particular weapon, an analysis of the bullet's surface must be made. Over the last decade, automated systems have been developed to perform this analysis.
Most of these systems operate by comparing two-dimensional (2-D) images from the surface of the bullet. To acquire the images, light is directed at the surface of the bullet, and a camera records reflected light. Because the reflected light is a function of the bullet features, captured data provide information about the striations on the surface. In such 2-D systems, however, reflected light is dependent on the characteristics of the bullet's surface, as well as the viewing angle of the camera, the reflectivity of the bullet's surface, light intensity, and accurate bullet registration.
"To overcome these limitations," says Benjamin Bachrach, director of electromechanical systems at Intelligent Automation Inc. (IAI; founded in 1986 by Leonard and Jacqueline Haynes), "it was necessary to develop a system capable of capturing the three-dimensional (3-D) topology of the bullet's surface." With the support of the US National Science Foundation, the National Institute of Justice, and Forensic Technology Inc., IAI has developed a system that generates 3-D maps of a bullet's surface using off-the-shelf PC-based imaging and motion-control components. The system can capture and store these data, providing forensic scientists with statistically correlated data about matches between bullets and weapons that may have been used in a crime. "In addition to not being susceptible to lighting variations of 2-D systems," says Bachrach, "the 3-D-based automated firearms evidence-comparison system is orders of magnitude faster than any manual microscope-based method."
Lands and Grooves
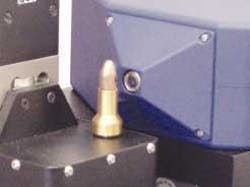
As a bullet travels along the barrel of a gun, the spiral rifling imparts a unique characteristic upon it in the form of land and groove impressions (see Fig. 1). The ability to identify the transitions between these lands and grooves is of critical importance for the automation of a bullet-analysis system. Therefore, the sensor to be used as part of such a system has to measure the transition between these impressions. "Because the slope of this transition is very high," says Bachrach, "most noncontact, laser-based sensors cannot measure this accurately enough."
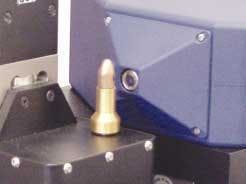
FIGURE 1. NanoFocus AF-2000 autofocus sensor images the land and groove impressions on a bullet. To properly measure these impressions, IAI has developed a 3-D-based imaging system using off-the-shelf imaging and motion-control products.
Indeed, one of the first challenges IAI faced in developing the 3-D automated comparison system was to determine a suitable sensor that could provide the required accuracy. To accomplish this, Bachrach and his colleagues made a number of different measurements with white-light interferometers on the surface of spent bullets. "This analysis," says Bachrach, "led us to the conclusion that a depth resolution of less than 1 µm and a lateral resolution of about 1 µm would be required."
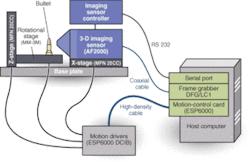
To provide the required resolution, IAI chose the AF-2000 autofocus sensor from NanoFocus. Having a range of 1.5 mm and a resolution of 0.025 µm, the sensor is placed on a Newport MFN 25CCx-y stage at a working distance of 2.00 mm from the bullet (see Fig. 2). "Because the resolution of the sensor is a function of the range of the sensor," says Bachrach, "we needed to place the sensor as close as possible to the bullet under test." This was done by placing the bullet on its own MM-3M rotational stage from National Aperture.
FIGURE 2. To provide the resolution required, IAI placed an autofocus sensor on anx-y stage at a working distance of 2.00 mm from the bullet placed on a rotational stage. When data from the cross-sectional stage of the bullet has been digitized, the x-y stage moves the sensor upward. Then, the rotational stage moves, allowing the laser-based sensor to collect another slice of cross-sectional data.
Both thex-y and rotation stages are controlled by an ESP6000-DCIB motion driver that is, in turn, connected to a PCI-based ESP-6000 motion-control card, also from Newport. After a bullet is placed on the rotational stage, the stage is rotated to provide x-y cross-sectional data of its surface. Data collected by the AF-2000 sensor are sent via an imaging sensor controller over an RS-232 interface to the host PC. When data from the cross-sectional stage of the bullet have been digitized, the x-y stage is indexed, moving the sensor upward. Then the MM-3M stage is again rotated, allowing the AF-2000 to collect another slice of cross-sectional data. Repetition of this collection process allows a complete 3-D topological map of the bullet to be digitized.
"Newport's stages and motion-control cards were very easy to integrate into the system," says Bachrach. "Because the company incorporates intelligence into the drives and controls, the motion controller automatically recognizes the parameters of the drive." However, because National Aperture's rotational drive was not originally compatible with the Newport controller, IAI had to develop a special hardware interface for the drive using Newport's motional-controller dynamic linked libraries (DLLs). "Once again," credits Bachrach, "Newport was very helpful in assisting us with the task."
Manual Methods
"In the majority of cases, only small portions of the surface are required to identify a bullet," says Bachrach. "These portions are discrete regions of the land impressions where the barrel of the weapon applies the greatest pressure against the bullet." When the bullet is roughly cylindrical (that is, it has not been severely deformed by impact with a target), the system can automatically locate these impressions and collect the relevant data.
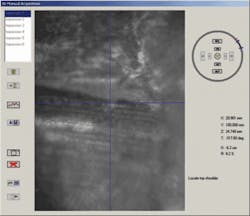
However, when the bullet is badly deformed, such impressions must be manually located (land impression by land impression). To do this, IAI captures RS-170 video output from the AF-2000 3-D imaging sensor using a PCI-based DFG/LC1 frame grabber from The Imaging Source. Although originally a PAL-based output device, the AF-2000 sensor was modified by NanoFocus to provide an RS-170 signal.
"Although the image provided by the sensor is of fairly low resolution," admits Bachrach, "it provides enough visual information to allow the location of the area of interest on the land impression under consideration. To do so, the user navigates over the bullet's surface using the position-control icon (see Fig. 3). The system automatically acquires the data of the region of interest indicated by the user. Usually, stresses Bachrach, such manual methods would be used only for badly damaged bullets. Otherwise, the user is merely required to locate a region with transitions, and the data-collection process is then automatic.
Although the graphical user interface (GUI) controls the motion of the system, images captured by the frame grabber are used only to position the bullet for the user. Developed using Microsoft C++, the GUI calls a number of custom-developed algorithms for data capture, motion control, and data analysis. In turn, these call the DLLs that control both the sensor and motion control of the 3-D analysis system. Running under Windows NT, the GUI-based software allows visualization of the data collected in a number of ways, including as cross-sectional land impression data and correlation statistics.
Analysis and Calibration
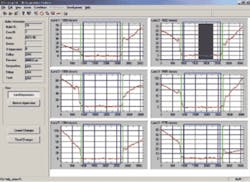
One of the options available is to view the cross section of the land impressions collected from the surface of each bullet (see Fig. 4). Although the placement of markers is automatically identified by the system, the user can overwrite these decisions with the interface.
FIGURE 4. Green lines (top left) highlight the transition points where land impressions begin and end, and blue rectangle (top right) indicates which part of the impression will be used for comparison between data from different bullets. Using this interface, the user can select which section of the surface of the bullet will be used for comparison.
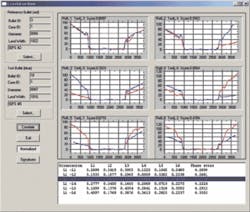
The user also can select from a number of data screens that show the correlation of data from different bullets (see Fig. 5). Because the bullets can be oriented several ways when placed on the rotational stage, the correlation between each land impression at each possible phase is computed and displayed. The higher phase score indicates the most objective orientation between the two bullets.
After successfully demonstrating the technology at the 1999 Conference of the Association of Firearms and Toolmarks Examiners, IAI was approached by Forensic Technology to develop a proof-of-concept commercial prototype. In developing such a system, it became apparent that manufacturing a number of such systems would require that each be calibrated. Since each machine in the field has different mechanical designs, says Bachrach, it is important that the possible misalignment between optical components is properly compensated. This requires that all the stages and the sensor be properly calibrated using an accurately known target such as a cylindrical rod with knownx-y and surface parameters. "When placed in each system, a calibration program, also written in C++, estimates and then compensates for any mechanical alignment problems," Bachrach adds.
Unlike DNA analysis, however, in which the probability of error can be as low as 0.01%, data from this system cannot, in its current implementation, guarantee such a probability. Such data, however, provide forensic scientists with bullet-correlation statistics that can, along with further evidence, give police officials better understanding of crime-scene data. "At present," says Bachrach, "we are performing a study for the US Department of Justice to understand whether a probability-of-error model can be developed by incorporating a large database of bullet data into the system."
Company Info
Forensic Technology Inc., Washington DC, USA www.fti-ibis.com
Intelligent Automation Inc., Rockville, MD, USA www.i-a-i.com
NanoFocus AG, Oberhausen, Germany www.nanofocus.de
National Aperture (NAI), Salem, NH, USA www.naimotion.com/rotary.htm
Newport, Irvine, CA, USA www.newport.com
The Imaging Source, Charlotte, NC, USA www.theimagingsource.com
