Image processing exploits wavelet analysis for enhanced compression
Image processing exploits wavelet analysis for enhanced compression
By Andrew C. Wilson, Editor at Large
The time/frequency localization achieved with wavelet techniques is especially useful in image compression. Techniques have been developed in which the best wavelet basis functions can enable the imaging signal to be represented by a small number of wavelet coefficients. These so-called sparse-codings make wavelets an excellent tool for data compression.
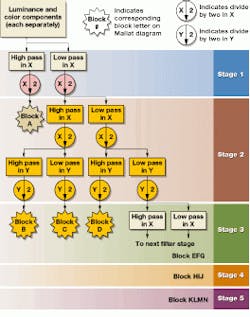
To compute the wavelet coefficients, a time-scale representation of the data is obtained using digital filtering. In a continuous wavelet transform, this representation is accomplished by changing the scale of the wavelet and shifting it across the signal. To perform this operation discretely, multiple stages of a low-pass and high-pass filter pairs are applied to the data signal in a pyramid operation to analyze the signal at different scales (see Fig. 1).
At each stage, the low-pass filter computes a smoother version of the signal, and the high-pass filter brings out the detailed information of the signal at that stage. In the first stage, the filters are applied to the original image. Then, at the next stage, the filter pair is applied to the smoothed and decimated low-pass output of the first stage. At every level, the filtering and subsampling results in half the number of samples (and half the time resolution) and half the frequency band spanned (and, therefore, double the frequency resolution). Once computed, the wavelet coefficients can be used to reconstruct the original signal or image.
If such filtering is applied to an image, the result is a series of images, one of which represents the smoothing average of the pixels in low-resolution space and the others represent the coefficients of the wavelet transform at various stages (see Fig. 1). To compress the image, these coefficients can be quantized using methods such as run-length encoding. In this way, high image-compression ratios can be obtained.
Choosing the type of wavelet function with which to compress a signal is of prime importance. To demonstrate, Alex Nicholaou of Waterloo Maple (Waterloo, Ontario, Canada) used the Haar transform to compress a Lena image (see Fig. 2). While the details of high frequency in Fig. 2--see feathers, eyes, and shades of the nose--are preserved in Haar wavelet compression, the quantization of the wavelet coefficients acts as a smoothing function in the areas of the image that are smooth. However, the result is unacceptable vertical and horizontal discontinuities in the reconstructed image.
To overcome this problem, different wavelet transforms can be used that do not create these harsh aliasing effects. One such wavelet filter, the Daubechies family, was discovered by Ingrid Daubechies (see "Comparing wavelets and the short-time Fourier transform," on p. 48), a professor in the mathematics department and Program in Applied and Computational Mathematics of Princeton University (Princeton, NJ). This filter is being used in an MMX implementation by Fastman (Austin, TX).
Fast wavelet transforms
Just as for the Fourier transform, a fast version of the wavelet transform -- called the fast wavelet transform (FWT)--has been devised. The FWT lends itself ideally to applications that require reordering of digital information. Its adaptability is most easily seen in the progressive transmission of an image over a digital data link.
Figure 3 shows information in a wavelet-compressed image being decompressed according to a user-defined ordering with wavelet software from Summus (Irmo, SC). The power behind wavelet data re-ordering is that incoming information builds on the information already received, resulting in no computational or information overhead. In other words, the time and information taken to compress an image piecewise are the same as decomposing the image all at once.
Software tools
In the past, researchers interested in analyzing signals with wavelet transforms were forced to attend signal-processing conferences or consult lengthy mathematical literature. Now, thanks to companies such as The Mathworks (Natick, MA), Mathsoft (Cambridge, MA), Wolfram Research (Champaign, IL), and Visual Numerics (Houston, TX), wavelet theories, functions, and utilities are available in off-the-shelf signal-processing software packages.
Using such packages, system developers can rapidly understand and visually experiment with wavelet bases and transformations and display the results in a graphical format. While such packages relieve the designer of the tedious task of programming specific algorithms, they also speed the time to market of medical, military, and seismic data analysis products based on wavelet technology.
As users of such packages become more accustomed to this unique extension of Fourier transforms (see "Fourier, wavelet, and signal analyses"), the wavelet transform is also expected to become commonplace. Indeed, companies such as Compression Engines (Houston, TX) , Summus, and Infinop (Denton, TX) are marketing wavelet-based compression software for what is projected to become the largest application -- transferring images over the Internet.
FIGURE 1. To perform image compression, the scaling function of the wavelet transform is performed by a series of decimation filters. In this way, the wavelet coefficients can be computed at a number of different stages, depending on the data size.
FIGURE 2. Choosing a wavelet for image analysis is a complex task. In image compression, quantization of wavelet coefficients results in unacceptable aliasing when the Haar transform is used.
FIGURE 3. Decompressing an image over a digital data link using wavelets is less computationally expensive than other methods because incoming information builds on the information already received.
Comparing wavelets and the short-time Fourier transform
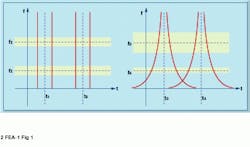
As with the short-time Fourier transform (STFT), the discrete wavelet transform (DWT) faces the classic time-frequency trade-off, the Heisenberg Uncertainty Principle. Adequate time resolution can be accomplished only at the price of deficient frequency resolution, and vice versa (see Fig. 1).
One advantage of the time-frequency plane of Fig. 1(right) lies in its relationship to the human auditory system; the human ear has an easier time discerning low frequencies. In addition, many audio signals have high-frequency signals that fluctuate more often than low-frequency signals given the same time delta. Consequently, the DWT might be a better choice in many instances.
Wavelet smoothing and detail extraction
Wavelets analyze a data set by simultaneously smoothing the data (that is, a simple linear averaging function) and extracting important details (that is, identifying major discontinuities). Note that smoothing the data is defined by the given wavelet as are the type of details extracted. The data set is systematically reduced by repeated stages of smoothing and detail extraction.
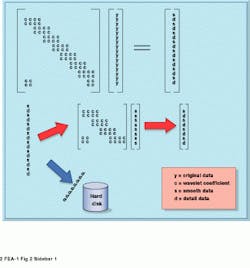
Wavelet transforms such as the popular Daubechies Wavelet Transform use a pyramidal algorithm to analyze data. The DWT used in this example is a Daubechies fourth order (DAUB4), which is popular due to its simplicity and localization. The DAUB4 is based on four wavelet coefficients, which of course were solved by Daubechies (see Fig. 2).
There are also a pair of FIR filters at work with a DAUB4 called the Quadrature Mirror Filter pair. This filter performs a dot-product between the wavelet filter coefficients and the input data vector. The output of the filter is a decimated (every other sample removed) version of the input data. Repeating this process recursively results in a group of signals that divide the spectrum of the original signal into octave bands with successively coarser measurements in time as frequency decreases.
The smooth data are the decimated output data which the transform matrix is again applied to over and over again until the end result is just two data points. Detail data basically describes the differences from one stage to the next. Therefore, only the detail data, not the smooth, need be stored.
Implementation of a 2-D wavelet transform on an array of data (that is, a 1024 x 1024-pixel image) can be performed by applying the 1-D WT as described above on each row of the array. When all the rows have been processed, the 1-D WT is applied to each column of the array, completing the 2-D transform.
During the pyramidal process, detail data [d in Fig. 2] with a magnitude under a predetermined threshold can be discarded. Here lies the reason for the Wavelet Transform being popular with compression applications. One motivation to compress data is to save disk drive space.
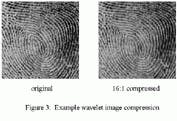
For instance, the US Federal Bureau of Investigation would need 200 Tbytes of data to store its current fingerprint archive if no compression techniques were applied (see Fig. 3).
Marc Couture
Spectrum Signal Processing
Burnaby, BC, Canada V5A 4V7
FIGURE 1. For the STFT, frequency bins are of equal size (see f1 and f2, left). The time window length is also constant over all frequencies, as shown centered around t1 and t2. Therefore, a constant resolution is preserved over the entire time-frequency plane. The DWT plays the trade-off game differently. Frequency bins centered at lower frequencies, such as f4 (right) have a higher frequency resolution than those centered at higher frequencies, such as f3. However, the time resolution is better for frequencies centered at f3 and poorer for those at f4.
FIGURE 2. The transform matrix is based on the four Daubechies coefficients. Each OccccO row is either c0, c1, c2, c3, or c3, c2, c1, c0, depending on its position. The data elements [y] of a 1-D vector to be analyzed are multiplied by the coefficients [c] of a Daubechies fourth-order transform matrix. The result is a vector of interleaved smooth [s] and detail [d] data (top).
To accomplish serious compression, any detail data that is not above a certain threshold is removed because it is not worth saving. Bottom figure demonstrates that the detail data are stored away after each iteration while the transform matrix is repeatedly applied to the remaining smooth data. This process can be repeated until only two data points are left.
FIGURE 3. Using wavelets, the main features of a fingerprint can be retained, with substantial reduction in storage size and a huge cost savings. This two-dimensional matrix is, in essence, broken down into vertical and horizontal vectors, whereby an array of digital-signal processors could attack individual vectors.
Fourier, wavelet, and signal analyses
In 1822, Baron Jean Baptiste Joseph Fourier discovered that arbitrary functions could be expressed by a single analytical expression. This method of analysis, now known as the Fourier transform, decomposes a function into a set of basis functions of sine and cosines. The coefficients of these functions represent the contributions of the sine and cosine components of the arbitrary function at all of its frequencies. Because of this, the Fourier transform is most useful in determining the frequency and power spectrums of time-varying signals.
Unfortunately, Fourier analysis has its limitations. By using sine and cosine functions as its basis functions, the Fourier transform assumes that the signal being decomposed is both periodic and of infinite length. Thus, the Fourier transform cannot easily represent sharp transient signals that are not periodic, such as those found in a chirp signal or in ECG waveforms. Worse, because no time dependence of the signal is provided, results are averaged over the entire duration of the signal. Therefore, for example, two signals that appear dissimilar in the time domain can produce similar power spectrums, thereby rendering interpretation difficult.
Wavelet functions
Like the sine and cosine basis functions used in the Fourier transform, wavelet functions can be similarly used to represent an arbitrary function or signal (see Fig. A). Such wavelet functions have been used to analyze certain signals such as ECG, radar, and seismic data that have sharp spikes or discontinuities. Like sinusoidal functions, wavelet functions can be integrated to zero. However, unlike Fourier-based functions that are only localized in frequency, wavelets are localized in both frequency and time and, thus, are more effective in analyzing transient waveforms.
Like Fourier analysis, wavelet basis functions preserve the original data in the form of coefficients. The wavelet transform uses a mathematical approach known as multi-resolution analysis to analyze signals at different frequencies with different resolutions. Here, the idea is to provide good time resolution and poor frequency resolution at higher frequencies, and high frequency resolution and poor time resolution at low frequencies. To do so, analysis is performed in a similar manner to the Fourier transform--the signal is multiplied with a wavelet function, and the transform is computed separately for different parts of the signal.
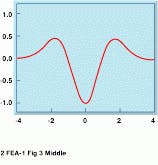
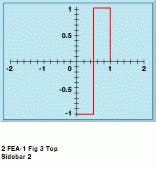
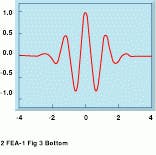
A number of transforms, such as the Haar, the Mexican Hat, and the Morlet wavelet, are available (see Fig. B). Depending on the type of analysis to be performed, one type of wavelet may be more effective than others. The Morlet wavelet, for example, combines a sine wave with a Gaussian envelope to provide a waveform of finite duration and of a specific frequency.
Signal analysis
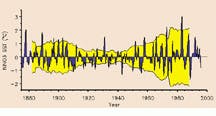
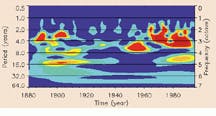
To analyze a signal, the wavelet function can be both translated (moved along the signal being analyzed) and scaled (changed its width). Here, high frequencies corresponding to low scales can be used to analyze spiked signals, and vice-versa. The wavelet transform can then be evaluated for various values of scale and time to provide information on relative power at specific points in the waveform. At the University of Colorado at Boulder (Boulder, CO), researchers Christopher Torrance and Gilbert Compo have applied the Morlet wavelet to the analysis of sea surface temperatures in the equatorial Pacific Ocean. The dominant mode of variability is the El Niño-Southern Oscillation (ENSO), which can be shown as high-frequency spikes on a time scale of two to seven years (see Fig. C top). Superimposed on the signal are longer interdecadal functions. By performing wavelet analysis and plotting the modulus of the transform, the researchers have demonstrated that from 1960 to 1990, the ENSO time band of two to seven years has undergone a slow oscillation in period from a three-year period between events in 1965 to about a five-year period in the early 1980s (see Fig. C bottom).
A. W.
FIGURE B. Wavelets have been developed in different forms. Three of the most common are the Haar, Mexican Hat and Morlet wavelets. The Morlet wavelet can be computed by multiplying a sine wave with a simple Gaussian function.
FIGURE C. Researchers at the Program in Atmospheric and Oceanic Sciences at the University of Colorado at Boulder have used wavelets to study El Nino effects. By transforming sea-surface temperature data (top) using the Morlet wavelet and taking the modulus of the result, researchers can more clearly see the periodicity of the El Nino effect (bottom).
