Protein Supplement
CCD-based system competes with laser scanning in 2-D gel electrophoresis for proteomic analysis
After the enormous impact genomics has had on understanding biological systems through genome sequencing, proteomics promises even greater rewards. According to Judit M. Nagy, director of the proteomics facility at the Institute of Biomedical Engineering at Imperial College London, clues to the solution of many biological problems in health and disease will be found through proteomics by revealing the identity of proteins at any given time in a population of cells and, ultimately, in single cells.
Advanced proteomic mapping and analysis requires separation and isolation of individual proteins from a complex mixture using 2-D gel electrophoresis (2-DGE). The “gel” in this case is a crosslinked polymer whose composition and porosity is chosen based on the specific weight and size of the target to be analyzed. The sample is applied to this gel. In first-dimension separation it is put through isoelectric focusing that separates proteins according to their isoelectric points. The second-dimension process separates proteins according to their molecular weights.
Imaging issues with all 2-DGE processes make reliable analysis challenging, including the fact that protein spots tend to overlap and show poor definition, and gels can be cluttered with “noise.” Many issues can also arise in the initial electrophoresis process that causes odd migration patterns. Therefore, it’s not just a matter of creating the protein gels, taking an image of them, and then starting analysis. Much depends on the ability of the imaging system to produce high quality scans or digital images and the ability of software to make adjustments to the resulting images so they are ready for analysis.
To map protein spots for true proteomic analysis, 2-D gels must be imaged into a format that the analyst can manipulate and work with. Typically, this is done using high-resolution laser scanning with fluorescent protein labels and then using one of the available software packages.
Technology package
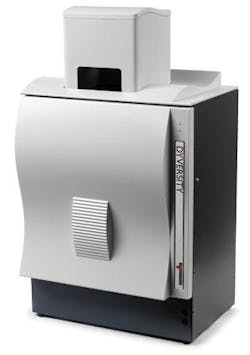
Originally CCD camera imaging was not seen as competitive as laser scanning because of image resolution. However, advances in CCD technology have ended that disparity. Syngene, a division of Synoptics, developed the Dyversity 6 2-D gel imaging system that features a 16-bit, 6-Mpixel CCD-based camera setup with a variety of lighting options housed within its own light-tight, compact darkroom. The system can generate 2-D protein gel images up to ten times faster than a conventional laser-based scanner and comes with a software suite that adapts to laboratory analytical needs (see Fig. 1).
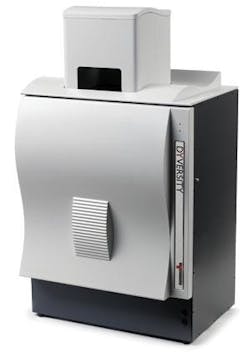
FIGURE 1. In the Syngene Dyversity 6 imaging system for 2-D gel electrophoresis, the 6-Mpixel camera, various lights, and filters are in a sealed darkroom enclosure.
The imaging system is designed to capture 2-D gel images from fluorescent, visible stained gels and chemiluminescent blots. The 16-bit cooled CCD camera can detect 65,536 gray levels, which allows it to resolve the high density and large dynamic range of proteins found on 2-D gels. It handles the capture of a range of gel sizes in a single shot, eliminating defects resulting from image stitching.
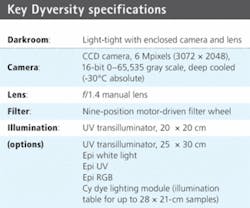
The Dyversity 6 uses CCDs that have a quantum efficiency of 64% at 600 nm. The 1.4-in.-format sensor has 6.3 million pixels in a 3072 × 2048 format, with a pixel size of 9 × 9 µm. This can be greatly extended by on-chip binning for high sensitivity up to 72 × 72 µm (see table). The CCD-based system can produce 2-D gel images in 10 s compared to the 8 min of a typical high-end laser scanner. In testing, results from both laser scanner and the Dyversity 6 imager showed a highly comparable pattern of protein peaks.
Creating the system
Paru Oatey, product manager for Syngene’s Dymension 2-D Analysis Software, says that initially the software had been developed for proteomic applications but could not find an imager that suited the required range. The company wanted to offer a full solution. When looking at 1- and 2-D gels, the system required a camera that could resolve the bands and spots very well.
Oatey says, “We had access to a laser scanning system, so we were able to set up some gels and image them on that scanner and then image them on the Dyversity 6 to make a comparison of the performance, quality, noise, and specifically image-acquisition time,” she says. “The comparison of signal to noise was good, and our CCD-based system was faster when it came to exposure time.”
“Cameras must meet our specifications and needs,” Oatey says. “We choose appropriate lenses that won’t compromise the resolution, and we mount them within our light-tight cabinet. Lenses must be able see both small and large imaging areas with equal acuity.”
She also notes that sometimes very good cameras with good lenses can only give good imaging in a very small area such as 10 × 10 cm, which is not useful when a gel can be as large as 20 × 20 cm. A large aperture on the lens facilitates reduced exposure times and hence improved image acquisition time.
“We are always scanning the market for new cameras and new lenses. When we find these, we can easily incorporate them into our system. We are not brand loyal. We are technology loyal,” she adds.
The darkroom enclosure is set up with various options for lighting: UV, white light, and blue, green, red light from above. There is also an edge-lighting module that produces red, green, blue light for the imaging of the cyanine (Cy) dyes. This edge module gives excellent spectral separation producing no crosstalk between the dyes. In addition, other fluorescent dyes can be imaged with this module. “We looked at different ways of lighting and hit on LED technology that worked very well for the system,” Oatey says. “Not only do we have lighting options for Epi and edge but we also have transilluminating options, for example, UV excitation, visible light, and blue light transmission.
A filter wheel allows users to have up to nine emission filters to match different types of dyes used on their gels. “We tell the filter vendors what light we want to capture and what light we want to block. When no filter is chosen Dyversity 6 can be used to image chemiluminescence with high sensitivity,” she says.
Reaping the benefits
In 2006, the Imperial College Proteomics Facility invested in the Dyversity system. Nagy’s research programs include proteomic characterization of stem cells and mapping the insulin-resistance pathway. She needed to set up her new facility with equipment to perform critical 2-D gel electrophoresis and subsequent gel analysis of protein samples. In her previous department, three separate scanning systems were used to perform separate types of protein imaging and analysis—one that could image fluorescent gels, another that could detect chemiluminescence, and a third to image stained gels in the visible range.
“I wanted to replace these three systems with something new and not too expensive,” she says. “The CCD camera can handle chemiluminescence and can image visible and fluorescent stains,” she says. “At the moment I use four filters, but that is less than half the options in the filter wheel.”
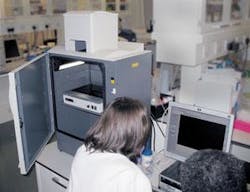
The Dyversity 6 can be fitted with a range of emission filters and UV and visible lighting options, making it versatile enough to image gels stained with Coomassie Blue, silver stain, SYPRO Ruby, Pro-Q Diamond, Deep Purple, and Cy dyes. The system can rapidly separate close protein spots in 2-D gel images, where spots are not perfectly resolved (see Fig. 2).
FIGURE 2. The Dyversity 6 has been installed at the Proteomics Laboratory of the Institute of Biomedical Engineering at Imperial College London for research that includes proteomic characterization of stem cells and mapping the insulin-resistance pathway.
Nagy notes that it takes training to use the system because the focusing is done manually. And the box configuration needs to be changed depending on the type of imaging performed. “Other than that, it’s pretty straightforward,” she says. “However, the main project we are working on is characterization of stem cells. So that’s when we use the differential gel analysis capabilities, which I would say is the most challenging application for any imager.”
The process uses fluorescently prelabeled proteins, which, when separated by 2-D electrophoresis, results in three different colors on one gel. “By creating three images from one gel, we can very easily overlay and look for the differences and common features between the two stem cell lines or cell culture media,” Nagy explains. “I can use all these fluorescent dyes, making image analysis and spot identification of proteins very easy.”
While there are excellent high-quality imaging products and also very qualified imaging software packages, in the past Nagy had run into issues. “When we went to the software company for a solution, it would tell us the input image was not of good enough quality. Then we would go to the scanner company and it would tell us the software was the problem. Basically, I wanted to get an image and then analyze it. I didn’t want to have to steps in-between that might be hard to reproduce” (see “Dedicated to Software,” p. 51).
To initially test the system, Oatey says that they used one of the most difficult and challenging applications, which was imaging gels that were treated with three different Cy dyes. These required specific wavelengths for excitation and specific filters for emission.
“It’s a multitasking application and very hard. One of the things we wanted to do was to compare the Dyversity images to the images from a laser scanner,” she says. “We already knew the limitations of laser scanners. One is the amount of time used to capture an image. When you have a number of gels to image you do not want the imaging system to be the bottleneck in the proteomics process. By utilizing a CCD camera we could speed up the image-acquisition time considerably without compromising on image quality.”
Dedicated to Software
DECODON has approached 2-DGE analysis with dedicated software. This strategy originated when a biologist, trying to do gel analysis with existing gel analyzers, decided it would be easier if gel images could be mathematically manipulated. He and a mathematician developed a software prototype that became Delta2D, which now provides image processing capabilities that include image warping technology, gel color coding, and complete expression profiles.
The software does not rely on a single image-acquisition technology, although Markus Kolbe, company CEO, emphasizes that the quality of the initial gel image capture is critical. While he concedes that many CCD cameras are growing in resolution he still recommends high resolution laser scanners. However, Delta2D supports high-end CCD imaging input and all scanners, including devices made by Fuji and GE Healthcare.
Key capabilities
Warping Within the electrophoresis chamber protein spots always run to a typical position. “But that position is never the same,” Kolbe says. “Spot positions vary across gels. This happens because of uncontrollable lab conditions. You would like to take two gels and put them on top of each other, look through them and see what has changed from one to the other gel. This is not possible because the spot positions are awry.”
These variations cannot be adjusted by shifting the whole image because the distortions are all different. Mathematical algorithms must be applied to shift the spots in an intelligent manner. “This image warping ability eliminates the differences in spot positions,” Kolbe explains.
Using warping technology, Delta2D can analyze as many gels as required. For instance, a project with four samples and five replicates for each sample results in 20 gels. “Because Delta2D can combine warpings to compute implicit relations between images that have not been warped directly, we recommend warping along the similarity of the images, typically between the images of each sample. This results in a warp strategy or warp graph,” Kolbe says. “Results can be easily controlled because you can create overlay images for every single pair.”
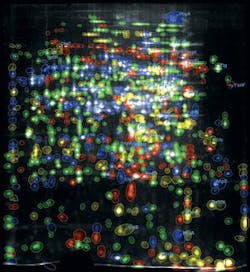
Delta2D software from DEDODON can show spots coded by colors that define proteins response to a certain set of conditions that are being studied.
Complete Expression Profiles An expression profile shows data for all the proteins in every image. “Once the warping is done, the software can create a fused image inwhich you can find the consensus spot pattern for the whole experiment,” Kolbe says. Delta2D identifies the objects on the fused image and applies the spot pattern to all the images. To quantify the object, it finds the object boundary on every image. When this has been done the result is spot quantities and complete expression profiles, meaning for every spot, there is a certain row in a table that includes all the data for that spot for every gel.
Full Color Coding Full color coding means more than simply dual channel imaging of two gels, such as orange for induced protein spots and blue for reduced spots, with black for where the spots match/similarities of the patterns. “With full color coding, as many colors as wanted can be assigned to visualize the results of the whole experiment,” Kolbe says.
In a drug experiment, for example, conditions A, B, and C might represent the responses of an organism to certain drugs. Protein spots that belong to the exclusive response to a single drug can be colored blue (A), green (B), or red (C), while the response to A + B or to B + C is colored in yellow or orange, respectively. By combining the different colors into one view, it becomes easy to distinguish between sets of proteins that belong to certain responses to the individual drugs or their combinations.
Delta2D includes automatic warping, which reduces image-manipulation time even further on prime quality images, reporting, and a statistical module. The statistics feature in Delta2D allows the scientist to load the computation data into the module, apply the test, and then have a list of interesting expression profiles.
