Algorithms provide more accurate citrus crop yield estimate
A University of Florida study used a number of imaging algorithms to find immature citrus in images captured under different light conditions and fruit hidden by leaves and branches in order to provide a more accurate estimate for citrus crop yields.
In the study—which was led by Won Suk "Daniel" Lee—100 images of the citrus fruit were captured at a research grove at the University of Florida’s Institute of Food and Agricultural Sciences using an off-the-shelf Canon PowerShot SD8800IS, which is a 10 MPixel camera with a 1/2.3" CCD image sensor and USB interface. Thirty-eight of these images were selected for training and the remaining 62 were selected for validation purposes using the algorithm, which was developed by Lee and his team using MATLAB and OpenCV.
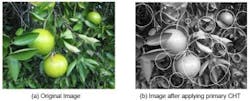
A basic shape analysis was conducted to find tentative locations of green citrus fruit. Since most of the fruit typically had a circular shape, the circular Hough transform (CHT) algorithm was used to determine the parameters of a circle, and based on the approximate size of the fruit in the training images, a radius range was estimated, and a search was performed within the radius, according to the study, which was published in the January issue of Biosystems Engineering.
In the next phase of the algorithm development, supervised framework was used. First, positive and negative samples were labeled to train the classifier using a small 20 x 20 pixel window from both citrus and non-citrus areas, then a classifier was built using support vector machine (SVM) with two types of features: local texture features and Tamura texture (coarseness, contrast, and directionality) features. In total, 10 features for the texture elements were chosen to describe the local structure of the surface.
From there, the scale invariant feature transform (SIFT) algorithm was used to detect and extract local feature descriptors which are invariant to changes in image translation, scaling, rotation, or partial occlusion. Interest points for SIFT features, called keypoints, were identified as the local maxima and minima of Difference-of-Gaussian filters at variable scales. The feature descriptor of a keypoint was calculated as a collection of orientation histograms on 4 x 4 pixel areas, each having 8 orientation bins. The values of these histograms were vectorized and normalized to create a feature descriptor, which generated a SIFT feature vector with 128 elements (4 x 4 x 8 = 128). Lastly, a threshold of 0.2 was applied, and the vector was renormalized to enhance invariance to changes due to non-linear illumination.
Page 1 | Page 2
About the Author

James Carroll
Former VSD Editor James Carroll joined the team 2013. Carroll covered machine vision and imaging from numerous angles, including application stories, industry news, market updates, and new products. In addition to writing and editing articles, Carroll managed the Innovators Awards program and webcasts.


