New Frontiers in Imaging Software
To broaden their markets, vendors are adding greater functionality to their software packages
Andrew Wilson, Editor
Customer demands for increasingly easy methods to automate production systems have led machine-vision software vendors to incorporate a number of high-level tools into their software packages. In the article “Applying Algorithms” (Vision Systems Design, February 2008), Ganesh Devaraj, CEO of Soliton Technologies, points out that a small group of machine-vision algorithms such as thresholding, blob analysis, and edge detection can be used to solve a relatively large number of typical machine-vision applications.
Although this premise is correct, software vendors have realized that there is a growing requirement from system integrators to support a broader range of applications in biomedical, robotics, military, and aerospace applications. Meeting these demands requires leveraging image-processing algorithms that expand the functionality of software packages beyond simple measurement functions.
A number of these algorithms are available in the public domain as source code, but they are only just becoming available as part of image-processing toolkits from major vendors. In developing any type of machine-vision application, a number of individual algorithms can be performed serially or in parallel on the image.
Before this process can begin, however, bad pixel correction combined with flat-field correction is often used to ensure pixels within the image return equal intensity values when an image is illuminated uniformly. These functions can be performed in a number of different ways and can be implemented within the on-board CPU, DSP, or FPGA of the camera; on the frame grabber; or within the host computer. Today, many camera vendors offer software support for these and other functions that can be embedded in third-party machine-vision packages.
Correct calibration
Even after a camera has been set up, a machine-vision system must be correctly calibrated so that any pixel measurements can be directly related to the dimensions of the object being inspected. To achieve this task, many software packages incorporate camera calibration software that allows the developer to use standard test charts from companies such as Edmund Optics to correct for camera perspective and lens distortion. In most machine-vision systems, this camera calibration is performed using a flat black-and-white checkerboard target of known dimensions.
Like bad pixel and flat-field correction, a number of different algorithms exist to perform camera calibration, perhaps the most popular being those developed by Zhenyou Zhang (see “A Flexible New Technique for Camera Calibration,” Microsoft Technical Report, 1999) and Roger Tsai (see “A Versatile Camera Calibration Technique for High Accuracy 3D Machine Vision Metrology Using Off the Shelf Cameras and Lenses,” IEEE J. Robotics and Automation, Vol. RA-3, No. 4, pp. 323–346, 1987). Zhang’s algorithm forms the basis for open source implementations of camera calibration in Intel’s Open CV and the Matlab calibration toolkit from MathWorks.
In both implementations, known points on the checkerboard (such as corners) are acquired and the independent set of data points generated used as the basis of a transform matrix to map the test object to world coordinates.
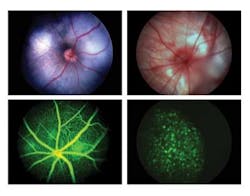
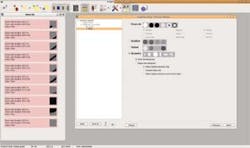
A number of different algorithms exist to extract and measure features with an image after image calibration is performed. Before any image extraction or measurement features are performed, it is often necessary to increase the contrast of an image or reduce the amount of noise present within it. Point operations such as histogram equalization can be used to improve the contrast and neighborhood operations such as filtering used to remove noise. Filters such as the Laplacian can be used to highlight image details; others such as the Prewitt, Roberts, and Sobel can also be used for edge detection applications (see Fig. 1).
Frequency domains
Although filtering is most often performed in the spatial domain, it is often useful to perform in the frequency domain, especially when convolution kernels are very large to remove—for example, very low-frequency noise. By transforming image data into the frequency domain using the FFT, DFT, or algorithms such as the Discrete Hartley Transform (DHT), simple point processing can remove such noise. The image can then be recovered using the inverse FFT, DFT, or DHT.
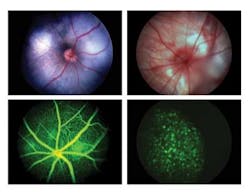
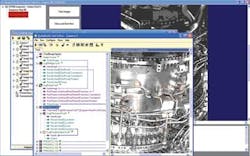
Despite the computational power required to perform such algorithms, the FFT is finding new life as multicore processors and higher-speed FPGAs become available. Available in software packages such as MIL from Matrox, Sapera from DALSA, and LabView from National Instruments, the FFT and variations of it can be applied to perform fast correlation whereby multiplying the FFTs of two independent images corresponds to the convolution of their associated spatial images (see Fig. 2).
Other applications of such techniques exist to filter temporal images. To compensate for atmospheric disturbance, for example, a technique known as speckle imaging was developed by David Fried to increase the resolution of images captured by ground-based telescopes (see “Optical Resolution Through a Randomly Inhomogeneous Medium for Very Long and Very Short Exposures,” J. Optical Soc. of America, Vol. 56, Issue 10, p. 1372, 10/1966).
To accomplish this, the power spectrum and bi-spectrum of each image is first computed using a Fourier transform to provide information about the amplitude and phase of the signal. Averaging this amplitude and phase information, recombining the image data, and computing an inverse FFT subsequently results in a corrected image. This technique has recently been implemented on an accelerated version based on an FPGA module from Alpha-Data by Michael Bodnar, senior engineer at EM Photonics (see “FPGAs enable real-time atmospheric compensation,” this issue).
Just as every machine-vision software package provides various ways to reduce noise in captured images, tools are provided for measurement, feature extraction, and image manipulation. These tools include caliper-based measurement devices, blob analysis and morphological operators, color analysis tools and image warping. Once analysis has been performed on individual images, it is often necessary to classify the results so that the machine-vision system can reject any potential defects, for example.
Image classification
To perform image classification, various algorithms can be used that fall into supervised, semisupervised, and unsupervised classification or learning techniques. In supervised classification methods, such as k-nearest neighbor and support vector machines (SVMs), images or features within images are classified by the operator and the system statistically characterizes these images or features.
As the simplest form of classification, the k-nearest neighbors’ algorithm (k-NN) generates vectors that describe an object in a feature space. In DALSA’s Color Tool, part of the company’s Sapera software, a variation of the k-NN algorithm is used to classify colors in different color spaces that include HSI, CIELAB, RGB, and YUV. After storing feature vectors that describe each color, unclassified colors are classified by first generating a feature vector and assigning classification criteria depending on how close this vector falls to its nearest classified neighbors.
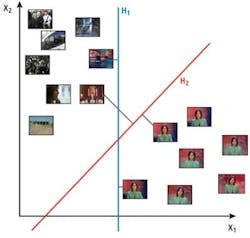
Since each image or object within the image can be characterized using a number of different parameters such as pixel intensity, color, size of blobs, and length of vectors of feature shapes, the analysis can be performed in Euclidean or n-dimensional space depending on the number of parameters. A more sophisticated method of classification, SVM, maps feature vectors so that separate feature categories are divided by a gap as wide as possible. Feature vectors of new images are then mapped into this space and classified depending on which side of the linear or nonlinear space they fall (see Fig. 3).
Today, SVMs are used in numerous applications including handwriting recognition, optical character recognition, classification of walnuts, and wheat grain classification. By incorporating this technique into its Manto object classification software, Stemmer Imaging has shown that the Manto software classified 10,000 digits of a test set not included in the training samples, with a recognition rate of 99.35%, using the characteristic features of 60,000 handwritten training samples (see “Support vector machines speed pattern recognition,” Vision Systems Design, September 2004).
Unlike supervised classification, unsupervised classification models such as self-organizing maps (SOMs) examine pixels or features within an image and class them based on these features. First described as an artificial neural network by Professor Teuvo Kohonen (see “Self-organized formation of topologically correct feature maps, ” J. Biol. Cybernetics, Vol. 43, No. 1, January 1982), such unsupervised classification does not require any specified training data. Rather, statistically similar pixels or features are grouped together into classes that replace the training sites used in supervised image classification.
Cognex uses SOMs in its VisonPro Surface software that is specifically targeted to web inspection applications. In a demonstration at the company’s headquarters, Markku Jaaskelainen, executive vice president of the Vision Software Business Unit, showed how the software could be used to classify objects or defects from a web running at 40 m/min using four 4k × 1 linescan Camera Link cameras from e2v.
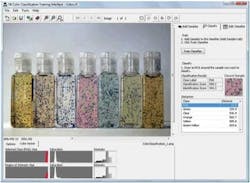
After the cameras were calibrated, digitized images were transferred to a single host PC using the Camera Link interface. Before features of interest within an image could be classified, image subtraction was used to remove the background from the image, leaving only the features of interest. These were then classified depending on a number of features such as grayscale, gradient, and geometry. Optionally, connected regions within each detected feature can be joined into larger groups using the Vision Pro Surface Software. After classification, a defect list can then be set up to name and highlight the defective regions (see Fig. 4).
While SVM and SOMs each have their own advantages and limitations, increasing the chance of successful classification in each is of great importance. Algorithms such as Adaptive Boosting (AdaBoost), originally formulated by Yoav Freund and Robert Schapire, can be used to improve classification performance (see “A brief introduction to boosting,” Proc. 16th Intl. Joint Conf. on Artificial Intelligence, 1999).
Other methods of improving image classification include combining both SOMs and SVMs into one. Indeed, this is the approach taken by Eckelmann in the design of an automated tracking and sorting system to read hand-written labels (see “Global Network,” Vision Systems Design, October 2008). In the system, Eckelmann used both a neural network (NN) classifier and an SVM classifier from MVTec’s Halcon image-processing software. Using a NN and SVM, results from both analyses are correlated and thus improve the accuracy of the overall read.
Despite this, the nondeterministic nature of SOMs and SVMs necessitates that a system’s requirements be carefully analyzed before these methods are deployed. According to Arnaud Lina, Matrox Imaging Library software leader, many customers require systems that return reproducible results and do not require supervised or unsupervised classification. Should a new parameter or defect need to be inspected, for instance, the impact of classification using SOM and SVM methods may not be easily measurable.
Stereo vision
Image calibration also performs an important role in extracting the 3-D structure of a scene from single, stereo, or multiple cameras. Single cameras are often moved over a scene robotically to capture multidimensional views of a scene; stereo systems use two cameras calibrated in world coordinates and the principles of epipolar geometry to determine 3-D structure.
This calibrated model is useful, but more biologically inspired methods exist to perform this task. These so-called uncalibrated models derive specific features from a scene, derive a correspondence model, and then determine the 3-D structure. Here again, a number of methods exist to extract these features including shape from shading and pattern matching. In shape from shading methods, objects in a scene are illuminated in an uneven way to obtain a topographic map. Images of gradient, reflectance, and curvature of features can then be determined.
Such methods are useful in imaging specular surfaces such as compact disc artwork and solder pads on PCBs (see “Lighting system produces shape from shading,” Vision Systems Design, January 2008), and reading Braille code on pharmaceutical packages (see “Machine vision checks Braille code on drug packages,” Vision Systems Design, January 2010).
In many applications, such as vision-guided robotics, it is not necessary to derive topological maps of objects in a scene but rather to derive 3-D positional information. While algorithms such as normalized grayscale correlation (NGC) can be used to perform this task, this type of algorithm requires that a system correlate regions of interest within both images to find the best match.
Pattern matching
Because NGC methods suffer from correspondence problems and are relatively variant to affine transforms, they have mostly been superseded by geometric pattern matching (GPM) algorithms. Using multiple sets of 2-D features, Cognex relies on its patented PatMax GPM tool in its 3D-Locate tool to determine an object’s 3-D orientation.
According to Jaaskelainen, the software can be used with robot-mounted single-camera implementations, stereo camera systems, or work cells with fixed-mount cameras. Lina says Matrox is also preparing to introduce such 3-D software, which will be based on a variation of Tsai’s camera calibration technique and the company’s own geometric model finder software.
Although many machine-vision software companies are unwilling to divulge how they perform GPM, known methods include the patented Scale-Invariant Feature Transform (SIFT). This algorithm was first published by David Lowe in 1999 (see “Object recognition from local scale-invariant features,” Proc. IEEE Intl. Conf. on Computer Vision, Vol. 2, pp. 1150–1157, 1999) and later patented in 2004. One of the main reasons for the popularity of SIFT is that it is invariant to affine transformations and 3-D projection and partially invariant to illumination changes.
In the SIFT algorithm, specific locations within an image that are invariant to scale change are found by analyzing a so-called scale space representation. To transform an image into scale space, it is convolved with Gaussian kernels for subsequent computation of difference of Gaussian images. Then, local maxima and minima in scale space are detected by comparing each point with all its neighbors. For each detected point, the local neighborhood is represented by a compact descriptor specific to the SIFT algorithm.
Because this is time-consuming, Pedram Azad, president of Keyetech, has replaced this scale space analysis and applied a fast corner detector and a rescale operation using bilinear interpolation (see “Software targets high-speed pattern-matching applications,” Vision Systems Design, February 2010).
When performing geometric image matching, the SIFT may result in a few incorrect matching points, which will affect the accuracy of any calculated 3-D coordinates. Because of this, the incorrectly matched points must be eliminated using nondeterministic iterative algorithms such as RANdom SAmple Consensus (RANSAC). This has been implemented by Azad and in an alternative implementation by Wang Wei of the State Key Lab for Manufacturing Systems Engineering at the Xi’an Jiaotong University, who has demonstrated the use of both of these algorithms for more robust pattern matching (see “Image Matching for Geomorphic Measurement Based on SIFT and RANSAC Methods,” 2008 Intl. Conf. on Comp. Sci. and Software Eng.).
Caliper-based measurement devices, blob analysis, morphological operators, and color analysis tools remain the most prominent measurement, feature extraction, and image manipulation tools of many software packages. Despite this, the need for software vendors to exploit new markets in medical, industrial, and military applications will lead to more sophisticated image-processing algorithms being added to these toolkits. While it is likely that image classification and 3-D measurement will be the first to be implemented, other algorithms such as adaptive histogram equalization, multispectral analysis, image stabilization, 3-D point cloud measurement, and motion analysis may soon be added to these toolkits.
Understanding descriptor-based matching
By Dr. Wolfgang Eckstein, MVTec Software, Munich, Germany
From the 1970s to the 1990s, finding objects in images was achieved by directly matching the gray values of a pattern to the search image, using techniques such as normalized grayscale correlation. Recently, other kinds of matching technologies have been introduced based on edge detection techniques. These are more robust when features are occluded and/or the illumination of a scene changes and are therefore more accurate.
MVTec Software’s Halcon library features descriptor-based matching algorithms that allow textured features within objects of varying scale and perspective distortion to be detected and classified.
Of course, other matching techniques such as descriptor-based matching, fast key point recognition, wide baseline matching, and Scale-Invariant Feature Transforms (SIFTs) do exist. These techniques use so-called interest points (also called key or feature points) to describe the object. The underlying method finds interest points such as corners, endpoints of lines, or spots in the image. A classifier is then trained to assign a unique class to each interest point. Because not all points may be classified correctly, a final matching process is applied. For this final matching, the RANdom SAmple Consensus (RANSAC) algorithm or Natural 3D Markers algorithm can be used.
Descriptor-based matching enables the location of objects with varying scale and perspective distortion. What’s more important is that the technique allows objects with texture-like appearance with < edges such as natural objects, print media, or plain printed text to be detected. For these kinds of objects, descriptor-based matching is more robust than edge-based technologies.
Company Info
Alpha-Data
Edinburgh, UK
www.alpha-data.com
Cognex
Natick, MA, USA
www.cognex.com
DALSA
Waterloo, ON, Canada
www.dalsa.com
e2v
Chelmsford, UK
www.e2v.com
Eckelmann
Wiesbaden, Germany
www.eckelmann.de
Edmund Optics
Barrington, NJ, USA
www.edmundoptics.com
EM Photonics
Newark, DE, USA
www.emphotonics.com
Keyetech
Karlsruhe, Germany
www.keyetech.de
MathWorks
Natick, MA, USA
www.mathworks.com
Matrox Imaging
Dorval, QC, Canada
www.matrox.com/imaging
MVTec Software
Munich, Germany
www.mvtec.com
National Instruments
Austin, TX, USA
www.ni.com
Soliton Technologies
Bangalore, India
www.solitontech.com
Stemmer Imaging
Puchheim, Germany
www.stemmer-imaging.de
Xi’an Jiaotong University
Xi’an, China
www.xjtu.edu.cn/en/
