Structured light system detects hazards for planetary surface navigation
Ara Nefian, Senior Scientist, Stinger Ghaffarian Technologies, Inc. (SGT) and the Intelligent Robotics Group at NASA Ames Research Center
Planetary rover navigation constraints include factors like limited onboard computational resources and power and lack of detailed knowledge of local terrain and illumination conditions. Capturing images in airless environments such as the Moon, Mercury, and asteroids presents a challenge as well, due to extreme imaging conditions related high dynamic range like bright sunlight or dark cast shadows. Suitable for use in such environments, autonomous and semi-autonomous rovers must be deployed with vision systems allowing them to see the surrounding environment.
Virtual bumper systems for obstacle avoidance in these environments represents one example of such imaging systems. Virtual bumpers are non-contact, in-close safeguarding sensors acting as the last line of defenses for hazard detection on rovers. Due to power considerations, the systems are typically the only always-on navigation sensors while driving in regions of total darkness. As such, the systems must quickly detect obstacles reliably within the restrictive requirements of planetary exploration missions.
Designed specifically by a team of NASA scientists for such tasks, the structured light-based system described in this article consists of a calibrated camera and laser dot projector system. The system determines the position of the projected dots in the image and through a triangulation process, detects potential hazards.
Related: Understanding the latest in high-speed 3D imaging: Part one
The system developed by the team consists of a single G-146 GigE Vision camera from Allied Vision (Stratroda, Germany; www.alliedvision.com), which is built around the 1388 x 1038 Sony ICX267 CCD image sensor from Sony (Tokyo, Japan; www.sony.com. The camera reaches nearly 18 fps at full resolution, offers Power over Ethernet, and uses a C-Mount lens from Zeiss (Oberkochen, Germany; www.zeiss.com) and a narrow band filter tuned to the wavelength of the Streamline Series laser from Osela (Lachine, QC, Canada; www.osela.com), which rejects solar light outside of the wavelength band of the laser projector. Both camera and laser connect to a laptop for processing.
The industrial grade laser projects a row of precise angularly spaced dots with high dot to dot uniformity and high efficiency. The camera detects the dots projected from the monochrome laser from a single image, requiring only that the projected dots outshine all other illumination in the scene. This is accomplished by ensuring that the ratio between the pixel intensity due to the laser projector illumination and the pixel intensity due to ambient illumination be larger than a fixed threshold.
Hazard detection
NASA’s hazard detection system consists of proprietary software along with OpenCV library. The software uses the projected laser dots to determine potential obstacles in the rover path. For this system, all projected dots align on the same epipolar line and the obstacles in front of the camera will determine only a shift in the horizontal position of the laser-illuminated pixels. Vertical position of the dots remains on the same image row. Such a design significantly reduces the image acquisition and processing time since the search for the laser dot location reduces to a single image line.
When there are two images available captured with and without the laser projected dots from the same camera pose and same illumination conditions, the image difference between these two images will select primarily the pixels illuminated by the laser together with low intensity image noise. This solution requires the rover to stop and ensure the two images are captured from the same camera pose.
The threshold value is selected such that:
Using a single image showing the projected laser dots allows the selection of all pixels illuminated by the laser projector using a fixed threshold value T such that:
In this case, the laser projected power must be significantly higher to ensure that terrain features of various slopes and albedo values are not confused for projected laser beams. Alternatively, under the assumptions of slow varying terrain features, a background region of interest (ROI) can be used. The background ROI has the same width, height, and left horizontal pixel value as the ROI containing the projected laser dots and is only shifted vertically by a fixed number of pixels. The background ROI approximates the appearance of the background image when the background image is not available and the threshold value T in this case is selected such that:
Doing so allows for continuous rover operation and reduced laser power intensity but relies on the assumption of slow varying terrain features. The output of this processing stage is a binary image of the ROI size obtained through thresholding. Pixels with intensity values above T value are set to one. All other pixels are set to zero and discarded.
The pixels in the binary image are grouped into several clusters using a connected component algorithm. The centroid of each cluster is computed through averaging of the position of all pixels belonging the cluster. Clusters with several pixels below a fixed threshold are removed.
Related: Understanding the latest in high-speed 3D imaging: Part two
The detection algorithm determines the number of laser dots within the ROI and their relative position. When the number of detected centroids in the ROI is lower than the number of laser beams, the algorithm detects an obstacle. This is due to the size of the image ROI relative to the maximum pixel disparity for a given acceptable obstacle. This case corresponds to occlusions or the detections of wide obstacles (positive or negative) or terrain slopes that shift all laser dots horizontally by more than the pixel disparity.
If the number of detected dots equals the number of laser beams, a simple correspondence based on pixel order is established between the expected location of the dots on a flat surface and their detected location. If the (horizontal) distance between the expected and detected dot position is larger than the pixel disparity for any dot, the algorithm detects an obstacle. This case corresponds to narrow obstacles (positives or negatives) that do not influence the location of all dots but only a subset of them.
Testing setup
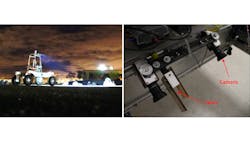
Physical experimentation of the virtual bumper on NASA’s K-REX2 rover (Figure 1) aimed to stress the design and learn about the parameters and performance in a Lunar-relevant environment. Testing occurred at NASA Ames Research Centers Roverscape facility, a two-acre outdoor planetary analog terrain with boulder distributions and average surface albedo (8%) similar to Lunar regolith (bit.ly/VSD-REGO). Day and night tests were conducted to recreate the illumination conditions in direct sunlight and inside shadowed craters, respectively. While daytime illumination distribution and spectrum are not a perfect match with the moon—which lacks an atmosphere—clear sky days were leveraged such that total incident illumination and dominant directionality were similar.
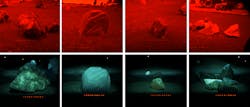
Obstacle test cases mirrored the geometric possibilities likely to be seen in craters at the poles of the moon. Figure 2 shows examples of the four main types of the obstacles encountered along with their relative sizes and reflectivities: large angular rocks characteristic of the polar surface areas, ejecta blocks characteristic of craters, smaller angular rocks, and complex aggregates from multiple small obstacles. Obstacle albedos ranged from <10% to 33% and were dissimilar to the general terrain surface albedo. This design offers a way of testing incident faces on obstacles that would be free of regolith accumulation. Within the scope of this paper, all the obstacles tested are positive (rocks) reflecting the relative prevalence of rocks versus craters and gaps (negative) in the size danger zone.
NASA’s K-REX2 rover was manually driven in the Roverscape while pushbrooming the virtual bumper in front. Speeds ranging between 0 and 20 cm/s were tested with 10 cm/s being the most common speed. Manual driving enabled the rover to weave cleanly between and reverse from obstacles without biasing results with navigation software in the loop. Images were taken at 0.5Hz rate, reflecting a mission requirement, timestamped, and processed offline. Obstacles were hand labeled in images with guidance from flagged timestamps where obstacles were encountered.
The camera was locked at F/5.6 aperture, 3.5 mm focal length, and ISO400 equivalent gain, while independent shutter speeds were chosen for day and night testing. These fixed shutter values were hand-tuned to produce 90% saturation of the laser dots in the resulting image. Ideally, a single shutter speed would be used for all conditions, enabling use of the system across bright scenes with dark cast shadows. However, due to dynamic range limitations of the camera, it was decided to collect clean data instead of introducing a minor operational detail. Other optical settings were chosen to reflect good depth of field and low pixel noises.
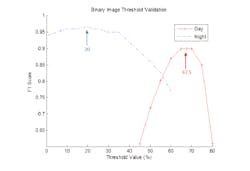
An image threshold controls what brightness level to accept if a pixel is illuminated by a laser dot (Figure 3). Two optimal thresholds exist for night and day due to the differences in total exposure. The large spread between these empirical values (50%) stems from both the decision to use different shutter speeds and the change in ambient illumination. The NASA team believes that while two optimal thresholds will exist due to the latter reason, the much smaller spread will allow a single threshold to work well in night and day images.
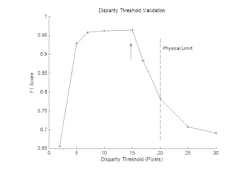
The minimum pixel disparity threshold determines if each laser dot has detected an obstacle based on the distance between the dot and its ideal flat-ground plane location along the epipolar line. The analytical value of the pixel disparity for the system parameter and obstacles of height h = 10cm is 15.9 pixels. As the system is designed with a neutral spacing of 20 pixels between laser dots, there is an upper disparity limit at which it is impossible to identify a shifted dot between neighbors (and granular obstacle detection capability is lost), though the software allows for such values. Based on validation data, it was empirically determined that a threshold of 15 (75% of the ideal spacing) strikes the optimal balance of precision and sensitivity (Figure 4).
Results
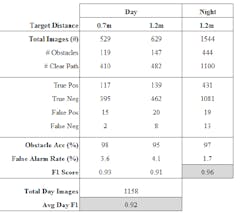
Table 1 shows Roverscape virtual bumper testing results. Used in evaluation of the virtual bumper were 1,158 day images across two sets and 1544 night images. Between 30-40% of the images were of obstacles and the rest were from clear paths. Two daylight tests were run with mechanical configurations that optimized detection for different target distances. Tests utilizing the second, 0.7 m configuration were conducted when it was noticed that the apparent brightness of the laser dots over the background terrain was much less than anticipated. The closer target distance increased the perceived brightness of the laser dots due to the reduction in square distance illumination falloff and a change in incident angle on the terrain towards the perpendicular.
Related: ShadowCam allows autonomous cars to see around corners
The positive obstacle detection accuracy of the virtual bumper is around 97% and is not significantly different between the day and night images. However, the false alarm rate (detection of obstacles when the path is actually clear) varies significantly from 1.7% at night to 4.1% in the worst of the day tests. This concurred with the visual observation that dots were challenging to perceive in daylight, despite use of monochromatic laser and narrow band filter. The average F1 score (the measure of a test’s accuracy) for day images is 0.92 compared to 0.96 for night.
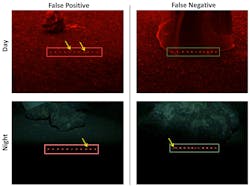
Figure 5 shows images representing typical erroneous classification in day and night testing. In day and night images, the most common false positive errors were the dots speckling as the rover drove over clear terrain or the introduction of new dots in the region of interest by bright terrain spots (day only). The major source of these errors is the result of terrestrial factors not represented in the ideal reflectance model. These factors included the blanket of granular pea gravel, compared to fine, powdered regolith which covers the moon. These granules both act as tiny occluders and introduce variegation in the terrain as they are not made of a macroscopically uniform material.
The total effect was such that the variability in surface terrain reflectance was at times greater than the contribution of the laser illumination, causing dots to speckle in the imagery. In day and night images, many false negative errors stemmed from labeling at the transition between clear ground terrain and rock obstacles. These labels have great uncertainty and given possibilities to exploit the sequential nature of pushbroom images, great performance in these regions is not important. Upon discarding these transition images, the positive obstacle accuracy is over 99%. A source of false negative error specific to night images is smearing of dots due to motion blur from long exposure time. While a dot that has moved sufficiently along the epipolar line should trigger a detection, motion blur creates an elongated blob where the centroid is within the disparity tolerance. This has reinforced the importance of fast shutter speeds, though it was unavoidable at the time due to camera availability.
It could be argued that the most important purpose of the system is correctly identifying obstacles that may cause catastrophic failure. For this, the virtual bumper performed quite well and could provide the last line of defense in dark craters, where a Lunar rover will be spending most of its time with intermittent stereo and flash illumination. The strong dark performance described here highlights virtual bumper value for this niche purpose. In future development, more realistic reflectance environments will be emphasized, and higher power laser technology will be investigated.
