Use Wavelength to Your Advantage in High-Resolution Imaging
Gregory Hollows
As light passes through glass materials, individual wavelengths are deviated to different extents. This is most commonly observed when sunlight passes through a prism creating a rainbow effect. While attractive, these effects create problems with resolving details in an imaging system.
To overcome this, many imaging and machine-vision systems commonly use monochromatic LED or laser illumination, which produces single wavelengths or narrow bands of the spectrum. These monochromatic wavelengths eliminate both lateral color shift and chromatic focal shift aberration.
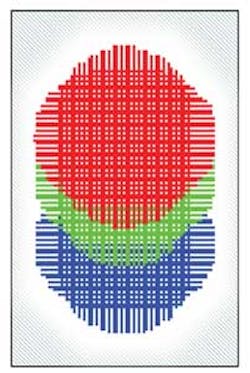
Lateral color shift is seen from the center of the image toward the edge of the image (see Fig. 1). As a result of this color separation, a given point on the object is imaged over a larger area, resulting in reduced contrast. In sensors with smaller pixels, this result is even more pronounced, as the blurring spreads over more pixels.
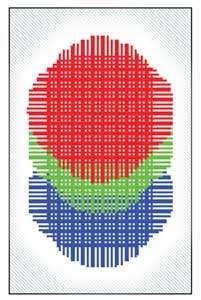
Chromatic focal shift relates to the ability of a lens to focus all wavelengths at the same image plane (see Fig. 2). In general, different wavelengths focus at different distances away from the lens. This shift in focus results in reduced contrast, since the different wavelengths create different-sized spots at the image plane.
Controlling resolution
Using different wavelengths of light provides the system designer with a means to control the attainable resolution of the imaging system. In such systems, the smallest theoretical spot that can be created by a perfect lens is defined by the diffraction limit. This limit is defined by the Airy disk diameter (ADD), which is the smallest area that a beam of light can occupy and still be focused.
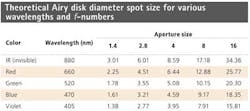
Defined as (2.44) × (f-number) × (wavelength), the ADD is a product of a constant, the aperture setting of the lens (the f-number), and the wavelength of light. This equation shows that there are two different ways to alter the minimum spot size that a perfect lens can produce. As the wavelength and f-number vary, the corresponding theoretical spot size also changes. The effects of applying this equation to LED wavelengths are seen in the table.
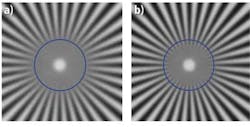
Lower spot sizes produce images with better resolution. The table shows that lens systems have better theoretical resolution and performance when used with shorter wavelengths. Figures 3a and 3b illustrate this effect by showing the performance of the same lens imaging a target at 660 nm and 470 nm, respectively.
The elements of this star target allow the changing resolution produced by a lens and camera system to be visualized in all directions. Both images use the same lens and a camera with 3.45-µm-square pixels producing the same field of view. By using a moderately high f-number (f/10) on the lens, aberrational effects are reduced. Thus, diffraction is the primary limitation in the system. As can be seen, the resolvable details in Fig. 3b are approximately 50% higher than in Fig. 3a.
However, from a lens design perspective, the further into the blue portion of the spectrum, heading toward short wavelengths, the less detail a lens may resolve regardless of how narrow the waveband that is used. Lenses to image short wavelengths do exist but they are often limited in their capabilities, and the exotic materials that may be required make them costly. The best theoretical performance seen in the table is at the violet wavelength of 405 nm, but many system designs cannot perform well in this area. Because of this, it is important to evaluate how a lens can realistically perform at such short wavelengths using lens performance curves.
The table indicates that the smaller the f-number, the smaller the spot size that can be created and thus the higher the resolution. However, setting a lens at an f-number below f/2.0–f/2.4 makes it difficult to approach diffraction-limited designs at higher resolutions and/or over larger sensor areas.
While running a lower f-number may appear to be the optimum choice, lens performance can suffer if the aperture is opened too widely. This occurs for a number of reasons, including limitations associated with the desired working distance of the lens and associated aberrational effects.
Finally, the diffraction limit is an absolute limit that does not take into consideration the quality of the lens. Even the best design will have performance limitations due to manufacturing tolerances, defects, and alignment issues associated with sensor placement, lens camera interfaces, and operating temperature. Essentially a lens may very well perform better at f/2.8 than f/1.4 due to aberrational effects and manufacturing and alignment tolerances. Thus, diffraction limit information should be used as a guide to selecting lens and lighting capabilities, but the absolute limit should not be used for creating expectations of system performance.
Different wavelengths
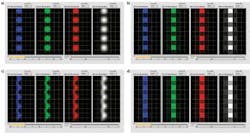
To understand the differences that can occur between theoretical and as-manufactured performance, Figs. 4–6 show what happens at the sensor level and how output from the sensor would be visualized with different wavelengths and f-numbers.
As can be seen, using the shortest wavelength possible can greatly increase the performance of any imaging system. Blue LEDs have become very dependable and cost effective in recent years and provide a good illumination source for high-resolution, small-pixel CCD- and CMOS-based cameras. Understanding the capabilities of a lens at different f-numbers and wavelengths will maximize the capabilities of these high-resolution imagers.
With an f-number of f/2.8, four different wavelengths are shown imaged perfectly in the center on a sensor with 3.45-µm-square pixels. This is considered a smaller pixel size, and it is associated with popular 5-Mpixel sensors used by many camera companies. Figure 4a shows the difference in spot size when changing from 470 nm (blue) to 880 nm (infrared) wavelengths. Figure 4b shows pixel outputs for each of the images created by the lens.
When the f-number is changed to f/8, all of the spots, regardless of wavelength, exceed the pixel size (see Fig. 5a). This results in noticeable blurring in the pixel outputs at the longer wavelengths (see Fig. 5b).
Lenses that include aberrational effects and issues that relate to manufacturing tolerances can greatly affect the performance of a lens (see Fig. 6). Using a lens with an aperture of f/8, aberrations become more pronounced at the center of the lens, altering the shape of the spots that are created (Fig. 6a) and leading to shapes that are no longer round. Figure 6b shows the pixel outputs for the image created by the aberrational effects. At the corner of this lens, triangular-shaped aberrations (Fig. 6c) result in more triangular-shaped spots (Fig. 6d).
Gregory Hollows is director of machine vision solutions at Edmund Optics (Barrington, NJ, USA; www.edmundoptics.com).
