Putting instrument panels through their paces
Paul Jones
Early analog vehicle instrument panels incorporated little more than a speedometer, tachometer, odometer and fuel gauge. Modern digital instrument clusters, on the other hand, are intelligent devices that communicate with an array of sensors distributed throughout a vehicle, enabling them to display numerous additional features.
Prior to fitting an instrument cluster to a vehicle, manufacturers must test each one to ensure that it will perform as expected. To do so, engineers at Alphr Technology (www.alphrtechnology.co.uk; Letchworth, Hertfordshire, UK) have developed a system to perform functional testing, calibration and verification of such instrument clusters.
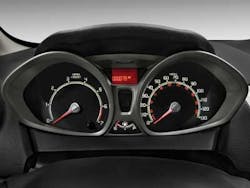
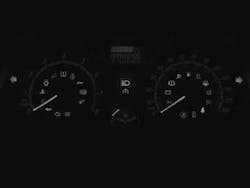
These instrument clusters consist of a set of three analog gauges with pointer needles, various warning lights and a digital display (Figure 1). While the gauge on the left displays the speed of the engine, the gauge on the right shows the speed of the vehicle. At the top center of the cluster, a seven-segment LCD indicates the mileage of the vehicle, outside temperature and engine gear position. Fuel status is also displayed on an analog fuel gauge.
Distributed across the instrument panel there are a number of tell-tale indicators that show the status of systems within the vehicle. These comprise a number of LEDs that illuminate graphical symbols or text on the instrument panel to alert the driver to engine malfunctions, low fuel, low oil pressure, battery voltage, low tire pressure and faults in the airbag system.
Functional testing
Before they are visually inspected, the system performs a set of functional tests on the displays in the instrument panel. To do so, the panel is robotically placed and pneumatically clamped onto a rotating fixture. During the process, a bar code reader captures data from a bar code printed on the unit to enable each of the units to be tracked through production.
Once mounted on the fixture, the instrument panel is connected to a set of systems through a connector on the rear of the unit. These emulate the systems that are employed in the production vehicle. By interrogating the devices in the panel, the system ensures that it can be remotely powered, whether the CANbus and measurement bus interfaces are operational and if the digital and analog displays are being driven. If the instrument panel passes the functional tests, it is then rotated 180 degrees on a turntable into the vision inspection station.
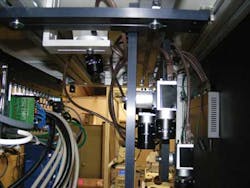
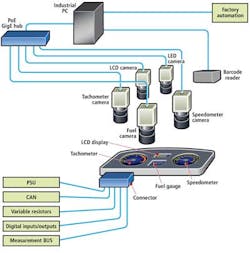
In the inspection station, four Basler Ace 5Mpixel GigE monochrome cameras from Basler (Ahrensburg, Germany;www.baslerweb.com) are placed directly above the center point of the tachometer, speedometer, LCD display and fuel gauge. A fifth Ace 5Mpixel color camera captures images of the tell tale indicators across the entire instrument panel.
Data from the five cameras is transferred over a GigE interface to a GigE switch into a rack mounted Intel multicore PC where the images are processed by Vision Pro vision inspection software from Cognex (Natick, MA;www.cognex.com). This PC also logs the bar code data (Figure 2). Since the panel itself is backlit, no additional lighting is required to illuminate the panels under test.
The image inspection system calibrates the analog speedometer, tachometer and fuel gauge on the instrument cluster, after which it verifies that they have been calibrated successfully. Secondly, it checks to ensure that all the elements of the seven segment digital LCD display and the color LEDs that illuminate the tell-tale indicators are functioning according to specification.
Calibration and verification
During the manufacture of the instrument panel, a plastic appliqué is clipped over the spindles of the gauges encircling all three with visual markers (or chaplets) and pointers are placed onto the spindles of each gauge. Ideally, the center points of the appliqué would be perfectly aligned with the centers of rotation of the pointers on the gauges.
In practice, however, the centers of the two will vary from one instrument panel to the next. Also the pointer placement onto the spindle will vary slightly from part to part. Hence, the gauges on each instrument panel must be individually calibrated to ensure that the pointers will provide an accurate indication of speed, engine speed and amount of fuel in the vehicle despite any misalignment of the two center points or variation in the pointer placement.
The process used to calibrate all the gauges is identical. For the tachometer, for example, the vision system must determine the angle that the tachometer pointer should be moved through in the vehicle to point to a specific chaplet. This is accomplished by calculating the angle that the pointer takes under test and the ideal angle that the pointer should ideally take to point to the chaplet. The difference in value between the two is then used to calibrate the tachometer.
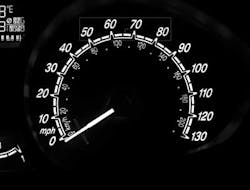
Prior to calibration, each of the three displays on the instrument cluster must be located within the vision camera's field of view. For the tachometer, for example, a pattern matching tool in the Cognex VisionPro software is used to teach the system the geometry of a specific region of the display. The software can then locate objects on the tachometer relative to the region it has been taught, despite any minor changes in the position or orientation of the cluster (Figure 3).
To calibrate the tachometer, the vision system software first determines the center of rotation of the tachometer pointer. To do so, the pointer on the tachometer is driven to a fixed position and an image captured. Caliper tools in the VisionPro library then locate two points along the line of the needle after which a line is drawn between them using line drawing tools. The needle is then moved through ninety degrees, after which the caliper software tools locate two further points on the needle, and a further line is drawn between them. By determining the intersection point of the two lines, the center of the pivot point of the tachometer pointer is determined.
These caliper tools also determine the location of the center points of the chaplets on the applique from which its center can be derived. This is achieved in two passes as the needle is moved from one position to another so that the location of the needle in the image does not interfere with the process. Lines drawn between the chaplets then determine the location of the center of the appliqué.
In the second stage of the calibration process, the tachometer pointer is moved through a given angle where it would ideally point at the center of a chaplet on the appliqué. An image of the pointer is processed by a further set of image calibration tools to determine the location of its center.
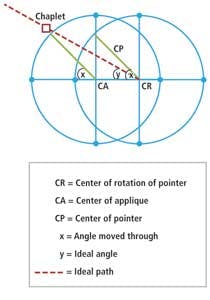
Having calculated the distances between the center pointer of a chaplet on the appliqué, the center of rotation of the appliqué, and the center of rotation of the pointer, the ideal angle that the tachometer needle should move can be determined. Similarly, the actual angle that the pointer has moved through can be derived from the distances between the center of rotation of the appliqué, the center of rotation of the pointer and the center of the pointer itself (Figure 4).
The difference in magnitude between the ideal angle the pointer should take and the measured angle is then used to calibrate the tachometer. This is achieved by adjusting the value of the stepper motor offset in the memory of the processor board in the instrument panel. Having applied the offset, the pointer should then point to the predetermined calibration point through the center of the chaplet.
To verify that is does, the instrument panel is powered down and back up again, after which the vision system runs through an identical test. The calibration and verification procedure is repeated for both the speedometer and the analog fuel tank gauge and the results of the procedures analyzed to indicate whether the unit has passed the tests.
Display testing
Unlike the analog pointers on the tachometer, there is no requirement to calibrate the LCD display, but simply to test whether all the seven segment display elements are functioning. Prior to doing so, a matching tool is again used to create a reference point from one of the LCDs on the display which the software uses to locate the other seven-segment LCDs on the panel.
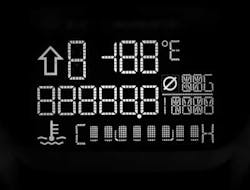
A CANbus command is then sent to the instrument panel to illuminate the segments of the display as well as the backlight. The fourth Basler monochrome camera in the system then captures an image of the entire LCD display which is transferred over the GigE interface to the PC. There, a set of calliper tools are run in sequence over each segment in the display images to look for dark to light edge transitions in the images of each display element. In doing so, the software can determine whether or not each segment of the display has been illuminated (Figure 5).
The last image processing tasks verify that all the LEDs that illuminate the graphical symbols or text legends on the applique are operating within specification (Figure 6). Once again, to enable a known template image of the panel to be located in another image of the panel, one of the graphical symbols backlit by an LED on the panel is first lit and located, after which a pattern match operation is performed.
Having done so, the Basler ace color camera in the system captures an image of all the backlit LED indicators on the instrument panel. Tools within the Cognex VisionPro library are used to define rectangular areas around each of the graphical symbols on the images of the instrument panel. The LEDs that light those symbols can then be tested in batches according to their color rather than individually to optimise the cycle time taken to test each panel.
To do so, the system issues a command to the panel to turn on all the LED indicators of one particular color after which the Basler ace color camera captures an RGB image of all of the illuminated symbols. The RGB values of the images of each specific batch of colored indicators are then transformed into Hue, Saturation and Intensity (HSI) color space. An image histogram tool from the Cognex VisionPro library is then run across each of the rectangular areas bounding the symbols to determine the number of pixels in the images that are of a certain intensity, saturation and hue.
By determining the intensity of light from the indicators, it is possible to ascertain whether they have been turned on. The hue values, on the other hand, enable the system to ensure that correctly colored LEDs have been fitted to the panel during the manufacturing process.
Improved cycle times
Having successfully passed both the functional and visual inspection tasks, the instrument panel is robotically offloaded from the system and another panel that has passed the functional test is rotated into the vision inspection station for calibration and verification. In this way, the system can perform the vision inspection tasks on one panel while a functional test is simultaneously performed on another, accelerating the cycle time of the process.
Because the instrument panel remains physically connected to the system throughout both the functional testing stage and during calibration and validation, the cycle time of the system is further optimized by analyzing the time taken to perform both processes and partitioning the software tasks between the two stages.
If the functional testing of the instrument panel takes longer than the vision inspection task, for example, a certain number of the functional tests may also be performed while the panel is undergoing visual inspection, further improving the cycle time of the machine. The partitioning of each of the systems is, of course, highly dependent on the specific complexity of the functional and visual inspection tasks to be performed on each individual manufacturer's instrument panel.
Paul Jones, Applications Engineer, Alphr Technology, Letchworth, Hertfordshire, UK
Companies Mentioned
Alphr Technology
Letchworth Hertfordshire, UK www.alphrtechnology.co.uk
Basler
Ahrensburg, Germany www.baslerweb.com
Cognex
Natick, MA, USA www.cognex.com
Vision Systems Articles Archives
