Hyperspectral microscopy serves biological pathology
Spectral unmixing and other image processing techniques applied to hyperspectral data reveal subtle color and texture differences not seen in standard microscopy images, improving pathology of biological samples.
Alexandre Fong, Mark Hsu, andMersina Simanski
Conventional histopathology relies on stained tissue cell specimens viewed by an optical microscope with transmission illumination. The most common stains—hematoxylin and eosin (H&E)—render the specimens as purple and pink, depending upon their morphology, structure, and associated chemical composition (acidic or basic).1 The introduction of fluorescence microscopy techniques has added the ability to examine cell condition and function in addition to structure in research and clinical diagnosis methods such as immunochemistry.2, 3
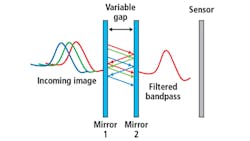
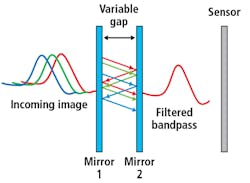
Figure 1. The basic principle of a Fabry-Perot interference filter is detailed.
However, interpretation of these images is often subjective due to limitations in human vision to distinguish subtle color differences particularly because of spatially-overlapping emissions. The complication can be compounded by other phenomenon such as quenching and autofluorescence, as well as the use of red, green, blue (RGB) color cameras because of their limited gamut. The inability to objectively delineate critical features such as tumor margins limits the effectiveness of such techniques.
Multispectral imaging improves on color camera performance by expanding the number of channels beyond the Bayer/RGB palette, but is still limited (typically 9–25 wavelength channels). However, hyperspectral imaging data cubes (hundreds of narrowband channels), when combined with image processing techniques such as spectral unmixing and classification, enable tissue features to be easily visualized and identified. Applying machine learning techniques in the classification process offers even more precise image segmentation that improves detection of cell morphology as well as structure and function.4
Hyperspectral imaging
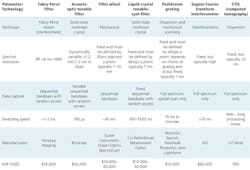
The ‘hyper-cubes’ of data generated by hyperspectral imaging cameras represent the wavelength spectrum collected for each pixel in the image. Subtle reflected color differences that are not observable by the human eye or even by RGB cameras are immediately identifiable by a comparison of spectra between pixels. A variety of spectral imaging technologies exist (see table).
Initially developed by NASA and mounted on satellites and airborne platforms for research purposes, the earliest hyperspectral cameras used pushbroom grating technologies. Over the past decade, there has been growing interest in adapting them for use in agriculture. However, these systems must be mounted on a platform that can move at constant velocity as they collect images by scanning one line of a field of view at a time.5
Band-sequential, front-staring, or snapshot imagers do not require mechanical scanning. Instead, a tunable filter that can sequentially select spectral bands is placed in front of the sensor and generates the hyper-cube by collecting complete images at each spectral band. The acquisition time does not depend on the number of pixels, but rather on the number of spectral bands being acquired. These imagers are especially attractive for applications requiring high spatial and spectral resolutions with tunable spectral ranges and a small form factor.
By controlling the reflectivity of the mirrors and their spacing in a classic Fabry-Perot interferometer (FPI) configuration, high-finesse spectral filtering can be achieved (Figure 1). HinaLea Imaging (Kapolei, HI, USA; www.hinaleaimaging.com) is the first company to incorporate this FPI-based filtering configuration in a battery-operated, handheld staring hyperspectral camera, which can capture multi-megapixel images in 550 spectral bands in as little as two seconds.
Because the embedded hardware in the camera enables real-time data processing, large data sets typically generated by hyperspectral systems are avoided. Rather, the camera can identify features of interest—both in the spectral and spatial domains—and classify these features in the image.6
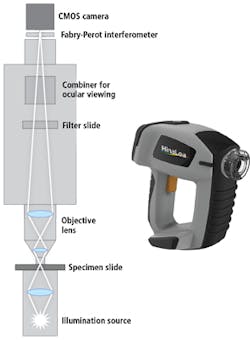
Figure 2. Coupling the camera port of a Fabry-Perot interferometry (FPI)-based hyperspectral imaging system (inset; HinaLea model 4100H) in an illumination microscope configuration gathers hyperspectral data cubes of samples to be imaged.
Unlike other band-sequential imagers that incorporate costly, power-hungry acousto-optic tunable filters (AOTFs) or liquid crystal tunable filters that can suffer from poor reproducibility, the FPI technology is easily configured for laboratory benchtop investigations or production line testing. And when coupled to the optical image path of an illuminated sample via the camera port, the system is easily configured for trans-illumination microscopy (Figure 2).
Spectral image processing
To make use of the abundance of data rendered by hyperspectral imaging, various image-processing algorithms have been developed over the years. These are essentially mathematical techniques for deconvoluting the multiple target spectral emission profiles or species, also referred to as endmembers.
For example, a hyperspectral image can contain a variety of dyed or stained tissues or fluorescent cell components. In fluorescence microscopy, the spectra for the differently-colored fluorescent chemical compounds in the specimen (fluorophores) of interest are the endmembers. As with the hardware, these techniques have their origins in satellite remote sensing research.
The most basic and common image-processing method in microscopy is linear spectral unmixing. This is a technique that is mathematically similar to solving for the coefficients in a set of linear equations and assumes that the spectra of each pixel are the sum of all the endmembers or spectra of interest. The method requires a priori knowledge (such as reference spectra). Various algorithms such as linear interpolation are used to solve n (number of bands) or equations for each band.
Another popular technique, spectral angle mapping, involves a vector representation of observed and targeted spectra to determine closest relationships in a multidimensional space proportional to the number of band passes. For example, if there are three spectra, two of which have vectors whose angles are very close, they would be grouped or classified together, whereas the third—which is farther than a user-defined threshold—would not be. Spectral angle mapping is widely used because of its insensitivity to differences in brightness.
The advent of widely-accessible machine learning methods has brought a new and powerful set of tools to this mapping endeavor. Among these include Principal Component Analysis (PCA), a dimensionality reduction technique to identify the dominant spectral signatures or endmembers in the image, and K-Means Clustering, a type of unsupervised learning algorithm that is used to find groups in the data based on feature similarity and classify them by common colors.7
The tissue pathology problem
To illustrate how image processing techniques can improve pathology of biological samples, images of a section of lung cancer tissue are processed using different techniques.
First, the specimen is prepared with H&E staining and a data cube is captured using a HinaLea hyperspectral imaging camera configured for microscopy with under 20X magnification and quartz tungsten halogen lamp illumination (Figure 3).
Figure 3. A raw H&E stained image of lung cancer tissue collected with the HinaLea hyperspectral microscope system under 20X magnification with quartz tungsten halogen lamp illumination (a) is compared to the classified image using a band selection approach with a priori information (b).
The data in the raw image shows different colors that represent the different groups of spectra in the pixels. To better distinguish the different endmembers associated with tissues types or fluorophores by their spectral components in the image, the raw data is processed by just sorting the pixels by broad wavelength or color bands.
Although the applied classification is successful in distinguishing between the more dominant spectra in the image, it is not a significant improvement over the raw image in that most of the differences are apparent to the naked eye.
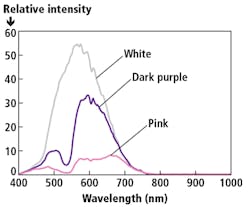
A review of the spectral elements in the image shows that there is spectral overlap between all the objects in the image (Figure 4). Basically, pixels where spectra overlap may be mislabeled or disregarded. This problem becomes even more pronounced when there are specimens with dark stains.
Figure 4. A sampling of the spectral profiles of individual pixels selected from a lung cancer tissue collected with the HinaLea hyperspectral microscope system with regions of the image denoted by their raw image color.
The hyperspectral/machine learning solution
Applying machine learning algorithms and techniques to the images such as PCA to identify the most likely endmembers and K-Means Clustering to group or classify them, we can improve the visualization of these components markedly.
Starting with a false-colored green image of lung cancer tissue collected with a HinaLea hyperspectral microscope system under 10X magnification with quartz tungsten halogen lamp illumination, a classified image is obtained that better represents the various endmembers or spectral signatures associated with the different tissue types and components by using a combination of PCA and K-Means Clustering machine learning algorithms (Figure 5). Pixel groupings are similar spectral profiles (false-colored), and cluster centers can be considered the endmembers or representative spectra.
Figure 5. PCA (Principal Component Analysis) and K-Means Clustering machine learning algorithms can be applied to a standard false-colored image (a), improving visibility of tissue components (b); pixel groupings are similar spectral profiles (false-colored), and cluster centers can be considered the endmembers or representative spectra.
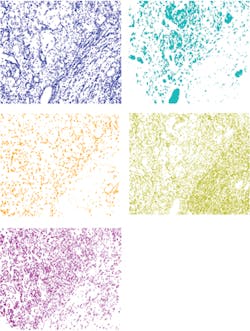
Moreover, individual layers can be viewed independently for improved clarity and ease of analysis (Figure 6).
By identifying distinctions in cells that are not only invisible to the eye, but also to color (RGB) cameras and even many multispectral imagers, the HinaLea hyperspectral imaging camera improves the precision and accuracy of current histopathology techniques and potentially, patient outcomes. Not only does the system produce high-spatial-resolution images, it easily enables the clear visualization of overlapping endmembers and a multiplicity of fluorophores, with clear benefits for research enterprises.
Figure 6. Images of each layer of the endmembers in this image show the separation of the five individual spectral components.
Moreover, the ability to dynamically change spectral range and bandpass capability means that the same instrument can be configured for a wide variety of stains and fluorophores to optimize image quality as well as reduce the time to capture images.
(This article was first published in the September 2018 issue of Laser Focus World.)
References
1. See http://histology.leeds.ac.uk/what-is-histology/index.php.
2. Y. Hiraoka, T. Shimi, and T. Haraguchi, Cell Struct. Funct., 27, 5, 367–374 (2002).
3. Y. Sung, F. Campa, and W.-C. Shih, Biomed. Opt. Express, 8, 11, 5075–5086 (2017).
4. G. Lu, L. Halig, D. Wang, Z. G. Chen, and B. Fei, “Hyperspectral imaging for cancer surgical margin delineation: Registration of hyperspectral and histological images,” Proc. SPIE, 9036, 90360S (Mar. 12, 2014).
5. C. H. Poole et al., Crit. Rev. Plant Sci., 29, 2, 59–107 (2010).
6. H. Finkelstein, R. R. Nissim, and M. J. Hsu, “Next-generation intelligent hyperspectral imagers,” TruTag white paper.
7. L. Gao and R. T. Smith, J. Biophoton., 8, 6, 441–456 (Jun. 2015).
Alexandre Fong, director of hyperspectral imaging, Mark Hsu, director of product development, and Mersina Simanski, product engineer, HinaLea Imaging (Emeryville, CA, USA; www.hinaleaimaging.com)
