Parallel processing and control systems Boost wood production
Parallel processing and control systems Boost wood production
By Shari L. S. Worthington
When lumber was inexpensive and large-diameter trees were plentiful, no one bothered to fine-tune wood-manufacturing processes. Indeed, prior to 1970, the cost of raw materials was only 25% of a sawmill`s total operating cost. In those days, the costs associated with inefficient material use were overshadowed by the costs of labor, manufacturing equipment, and storage.
In the last 30 years, this situation has changed. Today, trees are smaller in diameter, making it difficult to produce
long, wide sections of clear wood that are free of knots and other defects. As a result, the cost of raw materials now accounts for more than 70% of total operating costs. To maintain profitability, sawmills have had to reorient their operations by using more efficient plant equipment, manufacturing processes, and management practices.
Optimizing operations
In wood production, a tree is cut into logs and stripped of bark. Logs, which vary in length from 6 to 28 ft, are then cut along their length into boards or planks of uniform thickness and widths that vary from about 8 to 24 in. The boards are sorted by grade, stacked into lifts, and cured to harden the sap.
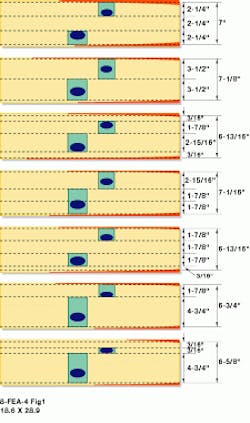
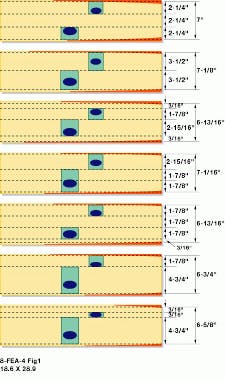
Each board is then planed and cut into fixed widths. The rip-saw operator, who cuts the wood in the direction of the grain, selects a combination of fixed rip widths (see Fig. 1). Once the boards are cut, defects are crosscut against the grain, and the remaining wood is free of structural and cosmetic defects. This clear wood is cut into fixed product lengths, placed on pallets, and used to make doors, windows, and furniture.
Traditionally only the crosscut saw operator developed the experience necessary to determine which lengths would fit between defects to make clear wood products. The rip-saw operator simply maximizes the longest and widest clear wood areas and then fills out the remaining board width with other rip widths, again using the longest and widest strategy. Little effort is given to maximizing the recovered value of the wood because such a calculation is too time-consuming for the ripsaw operator.
For years this approach was adequate, even though waste occurs when a clear section is either greater than or less than a fixed-length product. To reduce waste, knowledge of the product lengths needed in subsequent manufacturing operations must be introduced before the board is ripped.
If wood were mostly clear, a simple optimization strategy could control production. But wood contains many defects, and, given the goal of maximum value recovery, not every rip width is economically produced from any one board. As a rule of thumb, the likelihood of producing the most profitable lengths, long boards, decreases as the width of the rip increases.
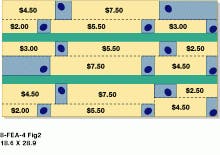
A board can be cut into product three different ways (see Fig. 2). The top solution is worth $22.50, the middle solution is worth $23, and the bottom solution is worth $26.50. Unfortunately, the bottom solution requires an unconventional sawing sequence of crosscutting first, then ripping, then crosscutting again. As this requires major changes in the sawmills sequencing of machinery, a machine-vision system was developed to improve existing ripping and crosscutting facilities.
The challenges
Until recently, machine-vision systems installed in sawmills used color bit-mapped images of boards. These systems tested pixels within the images against a color model. Pixels that closely matched the model were considered defect pixels. Areas of contiguous defect pixels were considered wood defects and crosscut out.
Unfortunately, pattern-recognition systems that use average-color models fail when the color of knots does not correlate to the model. Because of this, first-generation vision systems lacked consistency and accuracy when presented with variations of wood color.
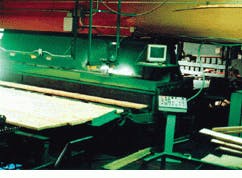
At Cognex Corp. Acumen Division (Portland, OR), John Goulding was challenged with improving a prototype machine-vision system designed to measure and inspect lumber and to automate rip-saw operations at a door- and window-manufacturing plant in southern Oregon. The technology was later purchased by Newnes, a Canadian manufacturer of wood-processing equipment. The resulting system, the OPtimizing RIPsaw (OP-RIP), relies on a color-correlation technique developed by Goulding to enhance the image and standardize the color space so that model-based feature detection of knots can be performed more rapidly. The system scans boards, processes color images, optimizes value recovery for production, and controls the rip-saw settings for each blade at an average rate of 17 boards/min (see Fig. 3).
Machine-vision system
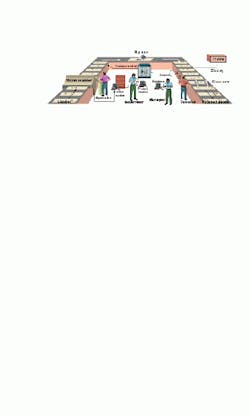
The OP-RIP system is a network of four PCs, 16 Acumen 900 vision processors, and one programmable logic controller (PLC) from Siemens Energy & Automation (Alpharetta, GA). While one PC acts as host processor to the 16 Acumen 900 vision processors, another provides a graphical user interface (GUI) to the production process. Another PC is dedicated to determining a rip solution, while the fourth manages the process and communicates with the PLC that controls the rip saw.
System functions are performed by an image processor, product value scheduler, board value optimizer, master process controller, and PLC (see Fig. 4). Each processor contains a video interface for cameras and monitors, video memory, a general purpose AT&T DSP32C CPU, and a Rockwell correlator chip that performs shape-based pattern matching.
The goal of the Image Processor (IP) is to reduce 16-Mbyte color video images to a coordinate-based board model text file. To accomplish this, the IP uses 16 TMC-74 color video cameras from Pulnix (Sunnyvale, CA) to acquire images from the top and bottom of each board. The 16 Acumen vision processors are used in parallel to process the images, determining board length, width, and location of defects. Parallel processing is required for the system to process a board in less than 4 s. The system measures features on each board with an accuracy of 0.05 in.
The board value optimizer (BVO) uses the IP`s board model data to calculate the optimum combination of rip widths to yield the highest dollar value of products. The BVO decides how to set the rip saw to rip the board end-to-end into smaller widths.
The product value scheduler works in conjunction with the BVO to monitor production goals, production rate of the rip saw, and consumption rate of the crosscut saws, ensuring that the rip solution fulfills dynamic production and inventory requirements and yields the highest total value of products. The rip solution is then sent to the PLC for real-time control of the ripsaw and associated mechanical feeders.
The master process controller (MPC) sequences all processes and communicates with the PLC. The main purposes of the MPC are to level processing resources and dedicate resources to critical-path tasks. All processing tasks related to producing a rip solution are on the critical path. Updating the video screens, reconfiguring product parameters, and monitoring production rates are all noncritical, background tasks. A second layer of real-time processing is provided by the PLC. Its processing tasks include emergency stop, feeder actions, photoeye sensors, and ripsaw control.
Specialized algorithms
Early in the system`s development, Goulding realized that color images of wood contain far more clear and clear-grain colored pixels than grain-knot and knot-colored pixels. Therefore, the image-processing operation could be increased by first statistically identifying and removing the clear and clear-grain color and using the accumulated data to simultaneously enhance and normalize the remaining grain-knot and knot-color pixels. This process, called adaptive color correlation, replaces the task of searching and testing for defect features directly (see Fig. 5). Using Goulding`s strategy, nondefect features are removed from an image first. The task of finding defects becomes faster and provides a real-time wood production system, capable of ripping an average of 17 boards/min.
Goulding also developed a strategy to maximize wood production by determining all possible product solutions for a board using feedback from the process in a closed-loop control fashion. Then, software selects the single best solution that satisfies value and production goals using a weighted-value method.
Today`s wood-processing operations can be vastly improved using new methods in machine vision and process automation. By first filtering nondefect colors, finding defects becomes easier and faster, resulting in more efficient production. Also, by using a PVS to dynamically balance the production of wood products from a ripsaw, systems can be developed that are capable of balancing the ripsaw production rate with the crosscut consumption rate in less than eight minutes of continuous operation. Taken together, a machine-vision system for sawmills allows the cutting of clear wood from lumber with minimum waste and maximum value recovery.
ACKNOWLEDGMENTS
The author wishes to thank John Goulding for his help in preparing this article. For more information see the Web: www.me.pdx. edu/capstone/johng/.
FIGURE 1. When ripping a board, a rip-saw operator can choose from seven different rip solutions generated from six fixed rip widths. Note that the hatched areas represent waste to be crosscut out.
FIGURE 2. Three ways product may be cut from a board. The top solution is worth $22.50, the middle is worth $23.00, and the bottom is worth $26.50.
FIGURE 3. OP-RIP machine vision system board scanner, operator`s console, and computer monitor shown processing wood at a door and window manufacturing plant.
FIGURE 4. The OP-RIP machine vision system controlls the product and information flow among associated processes of a wood-products manufacturing plant. The OP-RIP system architecture is based on four networked PCs.
FIGURE 5. The purpose of color correlation is to clean up the image and standardize the color space so that the detection of knots using a model is more efficient. (top) This color image shows a knot before and after color correlation (bottom).
