Color LED lamps enhance image contrast
LED lighting devices that span the color spectrum from infrared to ultraviolet help increase the image contrast of specific features.
By Andrew Wilson,Editor
With a growth rate exceeding 58% annually for the previous five years, the worldwide market for high-brightness, light-emitting diodes (LEDs) reached $1.2 billion in 2000 and accounted for 42% of the total LED market. According to a recent report by market-research firm Strategies Unlimited (Mountain View, CA), continued growth is projected, with the market expected to exceed $3.4 billion in 2005.
Dominating the market for blue, green, and white LEDs based on indium gallium nitride (InGaN) are Nichia Corp. (Tokushima, Japan), Toyoda Gosei (Aichi, Japan), Cree (Durham, NC), and Osram Opto Semiconductors (San Jose, CA). Major suppliers of yellow, orange, and red LEDs based on indium gallium aluminum phosphide (InGaAlP) include Agilent Technologies (Palo Alto, CA), LumiLeds Lighting (San Jose, CA), Osram Opto Semiconductors, Toshiba America (Irvine, CA), United Epitaxy Co. (UEC; Taiwan, ROC), and Epistar (Taiwan, ROC).
While these LEDs are appearing in commercial lighting, automobiles, and LCD backlighting products, they also are being used by a number of illumination companies to address machine-vision lighting requirements. In machine-vision applications, selecting the type of lighting needed largely depends on the size, surface features, and geometry of the part to be inspected. In many vision systems, LED lighting can be used in several configurations that include ringlights, spotlights, backlights, and diffuse lights (see Vision Systems Design, May 2000, p. 55). Now, with several semiconductor vendors offering LED lighting devices that span the color gamut from infrared (IR) to ultraviolet (UV), selecting the color or multiples of color illumination to use is a primary system-design decision.
"Different colors of LED light and types of light do not typically make a big difference on dimensional measurement applications," says Tom Groff, corporate products manager at Optical Gauging Products (Rochester, NY). "These [measurements] typically do not change when the frequency of the light source changes. However, when different-colored surfaces are being examined, different color LEDs and filters can be used to isolate a single color," he adds.
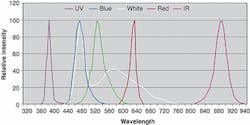
Semiconductor contrasts"RVSI/NER (Weare, NH) typically uses LEDs ranging from 370 nm (UV) to 940 nm (IR) to help create the contrast needed for any given vision application," says Marcel Laflamme, RVSI/NER vice president of sales and marketing. Because perceived color is a function of the property of the target, some areas will reflect one wavelength better than others; therefore, those areas will appear brighter to a camera. Other areas will absorb that same wavelength and appear darker.In a lighting problem solved by RVSI/NER, integrated circuits (ICs) were being installed upside down on a printed-circuit board (PCB). During circuit assembly, IC chips were incorrectly "flipped" in an automated-assembly step. Instead of being placed onto the substrate with the copper side down for proper electrical connection, the chips were flipped over, silver side down, which caused component and assembly failure.
To identify these assembly problems, a Nerlite 75-LED diffuse off-axis blue illuminator is used to highlight chip orientation. This lighting technique relies on wavelength and coaxial lighting geometry. The blue wavelength (460 nm) sharply differentiates the board's silver and copper surfaces. The copper absorbs the blue light and appears dark, whereas the silver reflects the blue light and appears bright. The coaxial lighting geometry eliminates unwanted glare, reflections, and dark spots.
Other colors can be used to enhance specific features within images. For example, View Engineering (Simi Valley, CA) manufactures a range of vision-based noncontact metrology systems including its View Voyager Series. For these systems, the company offers a number of LED ringlights that increase the overall image contrast between the inspected part's foreground and background features.
FIGURE 2. An auto fuse block was illuminated with both standard tungsten lighting and bluer light with a color temperature of 5500K. Although the change in lighting improves the ability of a human inspector to distinguish the fuses, it makes little difference when the image is captured and analyzed with a color CCD camera (top). To clarify this, quantitative measurements of the spectral properties of the various fuses were made (bottom). Comparing the spectra for the blue 60-A fuse with the green 30-A fuse shows why the machine-vision system can discriminate between these fuses, even at low saturation.
With LED illumination, the gray-scale contrast provided by a camera can be enhanced to highlight specific part features by the use of colored, monochromatic light that has been matched to the spectral sensitivities of the camera system. Consider the inspection of a PCB using through-the-lens white light. This light makes it difficult to reliably inspect PCB pads and traces; even oblique white-light ringlight illumination will not enhance the image. However, applying red LED ringlight illumination provides an enhanced image of the PCB pads without obstruction from the circuit traces. Moreover, illumination with a green LED ringlight provides an enhanced image of the PCB traces for measuring the circuit traces.
Although many semiconductor vendors use a number of LED frequencies, including red, green, blue, and white, to obtain higher-contrast images of PCB pads (red) and PCB traces (green), the primary role of the Optima 7300 post reflow system from Teradyne (Boston, MA) is solder inspection. "For this application," says marketing manager John Arena, "two key objectives needed to be achieved. The lighting in both the axial and radial lighting dimensions needed to be controlled precisely, and the solder contour needed to be measured at high speed. Other equipment suppliers use two or more color LED banks mounted at known, fixed angles, and the reflected color forms allow the contour to be discriminated more easily. Unfortunately, this requires the use of color cameras that carry a speed penalty," he adds.
At Teradyne, engineers elected to use a single color bank of controllable LEDs. The LEDs form unique patterns at speeds that reflect off joints in distinct ways for measuring good contours using only a single frame. A second benefit is that when used with the (default) color of green PCBs, the contrast achieved for solder is large. The green PCB shows up as black or near black, with bright mirrored solder regions.
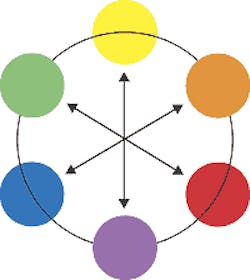
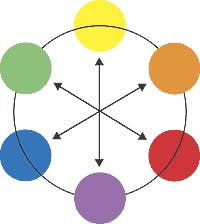
Which color?The choice of LED color to best illuminate a product is application-specific. "Generally speaking, using an opposite light spectrum will make a part feature appear darker, while using the same spectrum will make it appear brighter," says RVSI/NER's Laflamme. At RVSI/NER, a "color wheel" is often used as the starting point in selecting wavelengths for absorption or reflection (see Fig. 1). This wheel shows how colors are related; red, yellow, and blue are primary colors, and orange, green, and purple are secondary colors made by combining two primary colors.For simple color machine-vision applications, a light source that is predominantly at 636 nm (red) will be brightly reflected from a part that is perceived to be red. Similarly, a light source that operates predominantly at 533 nm (green) will not be reflected from the same red part and will appear dark. "Vision applications that leverage wavelengths to solve problems can be very subjective, and if parts being imaged vary in surface color from one to another, or from lot to lot, the process may yield inconsistent results," says Laflamme.
Although different wavelengths of light can be used to increase the contrast of specific colors within an image, quantitatively comparing different colors within images requires an understanding of illumination methods, viewing angles, and the properties of the image sensor. To illustrate this approach, Mike Muehlemann, president of Illumination Technologies (East Syracuse, NY), illuminated an auto fuse block with both standard tungsten lighting and bluer light with a color temperature of 5500K. Although the change in lighting improves the ability of a human inspector to distinguish the fuses in the image (see Fig. 2), it makes little difference when the image is captured and analyzed with a single-chip TK-1070U color CCD camera from JVC Professional Products (Wayne, NJ).
To clarify this situation, quantitative measurements of the spectral properties of the various fuses were made. "These quantify the photonic distributions that the camera sees, assuming the use of a perfect white-light source with uniform distribution from all visible wavelengths," says Muehlemann. "Comparing the spectra for a blue 60-A fuse with those for a green 30-A fuse explains why the machine-vision system can discriminate between these fuses, even at low saturation," he adds.
These data also show why it is more difficult for the vision system to separate red 40-A fuses from brown 20-A fuses. Although the spectral curves for the fuses are similar, they can be readily distinguished by the human eye. From the data, adding blue light to these two fuses has no effect. In fact, adding a more reddish light appears to enhance the characterization.
Company InformationDue to space limitations, this Product Focus does not include all of the manufacturers of the described product category. For information on other suppliers of lighting and illumination, see the 2002 Vision Systems Design Buyers Guide (Vision Systems Design, Feb. 2002, p. 53).Agilent Technologies
Palo Alto, CA 94303
we.home.agilent.com
Cree
Durham, NC 27703
www.cree.com
Epistar
Hsinchu, Taiwan 300, ROC
www.epistar.com.tw/
Illumination Technologies
East Syracuse, NY 13057
www.illuminationtech.com
International Lighting Committee
Wien, Austria
www.cie.co.at
JVC Professional Products
Wayne, NJ 07470
pro.jvc.com/prof/jvchome1.html
LumiLeds Lighting
San Jose, CA 95131
www.lumileds.com
Nichia Corp.
774-8601 Tokushima, Japan
www.nichia.co.jp/
Optical Gaging Products
Rochester, NY 14621
www.ogpnet.com
Osram Opto Semiconductors
San Jose, CA 95134
www.osram-os.com
PPG Industries
Pittsburgh, PA 15272
www.ppg.com/default_ns3.htm
RVSI/NER
Weare, NH, 03281
www.nerlite.com
Strategies Unlimited
Mountain View, CA 94040
www.strategies-u.com
Teradyne
Boston, MA 02118
www.teradyne.com
Toshiba America
Irvine, CA 92618
www.toshiba.com/taec/index.shtml
Toyoda Gosei
Aichi, Japan 452-8564
www.toyoda-gosei.co.jp/
United Epitaxy Co.
Hsinchu, Taiwan 300, ROC
www.uec.com.tw/
View Engineering, Inc.
Simi Valley, CA 93063
www.vieweng.com/main.htm
X-Rite
Grandville, MI 49418
www.xrite.com
The CIE L*a*b* system is used in the quality control of colored products, where the color of the production sample is located in L*a*b* space and compared to the color standard. Color differences between the production sample and standard are then computed and compared to the limits of customer acceptability for the colored product. To measure this effectively requires the use of a spectrophotometer, an instrument capable of illuminating an object at a known color temperature or at a range of color temperatures, such as D65 (daylight) with a color temperature of 6500K, A (tungsten) with a color temperature of 2856K, and F2 (fluorescent) or cool white.
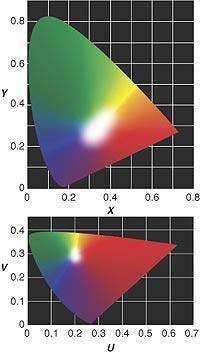
The 1931 CIE standard observer defines three primary colors for color measurements and defines for each wavelength interval the amount of each primary color required to match a spectrally pure color (top). Although the 1931 system was useful, it did not express differences between colors in a uniform perceptual manner (bottom). As a result, the CIE improved the system in 1976 by introducing the CIE L*a*b* system, which organizes colors so that numeric differences among colors agreed consistently with visual perceptions.
There are many different types of spectrophotometers available for measuring color with different kinds of surface finishes. For measuring color on surfaces with a consistent gloss level, a 0°/45° spectrophotometer can be used. In this design, illumination is perpendicular (0°) to the sample plane, and the detectors are positioned at 45° to the plane of illumination. Because the instrument uses a direct light source, any change in gloss or texture is detected as a color difference. For surfaces with an inconsistent gloss level, a diffuse/8° spectrophotometer can be used. Because diffuse illumination is used, matte and gloss products of the same color pigmentation appear as two different colors since glossy samples redirect the light in one general direction. If the 0°/45° spectrophotometer were used for these products, the readings would be nearly the same.
However, these spectrophotometers proved useless for engineers at PPG Industries (Pittsburgh, PA), the second largest paint plant in the world. There, Ray Gravelle, manager of automotive quality services, was confronted with demands from automotive manufacturers for exact and documented color matching. Automobile paints that contain mica, aluminum flakes, or an interference pigment endow finishes with a special appearance.
Because the color of these finishes changes as the surface is viewed from different angles, a multi-angle spectrometer developed by X-Rite (Grandville, MI) is used. In these devices, a direct light source illuminates the object at 45° and measures reflected light at angles of 15°, 25°, 45°, 75°, and 110°. Using Windows-based software in conjunction with the spectrophotometer, an acceptable numerical tolerance for the instrument's readings can be developed in a number of color spaces including L*a*b*. During operation, the software compares the sample to a previously specified standard so that an exact color comparison can be made at different viewing angles.
Information on color measurementsPrinciples & Techniques of Color Measurementby Timothy A. Mouw, X-Rite Inc.specad.org/technical/xrite/Color Quality of Automotive Finishes Goes High Techwww.pfonline.com/articles/059802.htmlOptimal Wafer Illumination for Machine Vision Applications on Silicon Waferswww.swtest.org/2001proc/PDF/S4_01.pdfThe Color Guide and Glossarywww.rit.edu/~nxspph/ps/xrite.pdfInspection in Semiconductor Manufacturingwww-ismv.ic.ornl.gov/publications/SemiconductorInspection.pdfColor Chromaticity Diagramswww.efg2.com/Lab/Graphics/Colors/Chromaticity.htmFluorescence and Colorwww.labsphere.com/tech_info/docs/Fluorescence_and_color.pdf


