Three-dimensional imaging aids sorting of raw rubber
Andrew Wilson, Editor, [email protected]
Although many rubber products are produced with petroleum, the resilience of natural rubber from plants grown in Southeast Asia makes it more suitable for the production of radial tires. Because of this, some tire vendors import large quantities of raw rubber products for the manufacture of their products.
Raw rubber is delivered in nonuniform containers approximately 2 × 1.6 × 1.2 m. “Not only do such packages vary in color, size, and weight, they are often randomly packed,” says Tobias Berlin, president of ACT Systems (Karlsruhe, Germany; www.actechsystems.de). “Perhaps worst of all, rubber in its natural form emits a rather pungent odor,” he adds.
Before raw rubber can be processed, it must be unloaded from these containers and placed on a production line. In the past, this process has been handled using manual labor. To reduce costs, however, tire manufacturers are looking to automate the process using machine vision. “Unfortunately,” says Berlin, “two-dimensional gray-scale or color machine-vision systems cannot be used for this process, since they are unable to detect the gaps between the randomly oriented packages or the height between them.”
Since an imaging system must be capable of instructing a robot picker to do this task in real-world coordinates, Berlin and his colleagues used a three-dimensional approach based on an LMS 400 laser measurement system from SICK (Dusseldorf, Germany; www.sick.de). “With its 3-m range, 0.1° angular resolution, and integrated Ethernet interface, the LMS 400 has the necessary speed and accuracy for the multidimensional detection of boxes and pallets and objects within or on them and for generating the appropriate information for a robot controller,” says Berlin.
The LMS is mounted on an aluminum rail and moved over the pallets of rubber as they arrive at the manufacturing facility. With an aperture angle of 70°, the LMS 400 generates approximately 800 profile lines across the length and width of the pallets. “In addition to determining distance and angular data, information in the returned data string includes the energy of the emitted laser pulse reflected from the object.
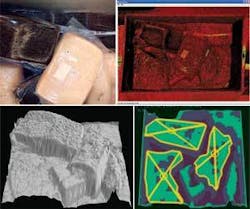
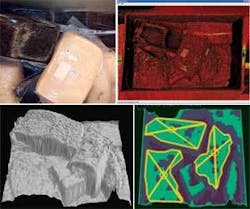
“This is useful,” says Berlin, “where distance measurement alone is no longer sufficient to allow differentiation between individual objects.” Such data can be used, for example, to differentiate the edge of the palette (which is made of metal) and the rubber contained within as the reflectivity energy from the metal differs significantly from that of the rubber. Of course, before a machine control system can guide a pick-and-place system to grip the rubber packages within, this data must be processed and rendered as a three-dimensional map (see figure).
After 3-D data are collected, they are transferred over the Ethernet port of the LMS 400 to a PC for visualization. ACT Systems has developed a set of PC-based tools based around algorithms originally created for the visualization of data from finished tire products (see Vision Systems Design, Feb. 2006, p. 31). Raw image data consisting of x, y, and z positional information and an 8-bit reflected energy level for each point on the scan are then reformatted as a height profile for each line that has been scanned.
“To properly determine the position of the rubber packages in the palette, the gradient change within specific ranges of the topological map must be calculated. Should, for example, a slow gradient occur, this could indicate a variation due to the wrapping of the rubber packages. However, if a sharp gradient occurs, then this probably indicates a gap between the packages in the palette,” Berlin says.
Once the coordinates of each package are determined, the central point of each bale can be identified and the coordinates sent to a PLC over the RS-232 interface. In the final production version of the system, this PLC will be used to control a Kuka robot (Sterling Heights, MI, USA; www.kukausa.com) fitted with a custom-built gripper.

