To help identify key design trends in machine vision for 2020 and into the future, we launched the Solutions in Vision 2020 global audience survey. Taken by 320 machine vision professionals, the survey and article helps shed a light on how much our audience uses the following hot-topic technologies: deep learning, multispectral/hyperspectral, polarization, embedded vision, 3D imaging, and computational imaging. Additionally, the survey highlights some of the major challenges and problems encountered by our audience today.
Deep learning
Deep learning has undoubtedly become one of the hottest topics in machine vision, but just how many people use it?
For OEM machine builders, a lot, as 73% currently use deep learning technology, with 35% using it often and 38% using it seldom. Systems integration company respondents use the technology often at 41%, while 19% use it seldomly, and 32% aren’t using it but may in the future. This represents a total of 92% of the systems integration group who use or may use deep learning technology in the future.
Sixty percent of those in research and development (R&D) use deep learning right now, but a total of 94% use it now or may opt to use it in the future. The only respondent groups with less than 60% indicating current deep learning use are end users/manufacturers at 34%.
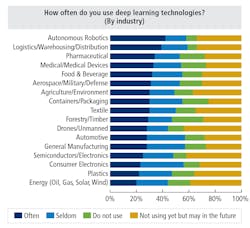
Industries where total deep learning technology use is highest were logistics/warehousing/distribution at 59% total usage, followed by autonomous robotics at 58%, and automotive at 57%. Of these groups, 42% in the autonomous robotics group use it often, while 39% in the logistics/warehousing/distribution group do as well. For those currently using deep learning or considering it for the future, the largest groups were the logistics group at 93%, the autonomous robotics group at 92%, and the semiconductors group at 90%. (See table below).
For deep learning applications, the results showing the groups currently using it the most are a bit surprising. Using most among application groups listed here is the infrared imaging group at 67%. Augmented/virtual reality follows at 66%, and unmanned/autonomous and X-ray imaging at 65% each. The largest groups either using or potentially using deep learning in the future are the remote sensing group (96%) the web inspection and logistics/warehousing/distribution groups (95%) and infrared imaging and guidance/tracking systems groups (94%).
Using deep learning the least among these groups, and perhaps less surprising, are the life sciences and forensics groups (21% each) the medical imaging group (17%), and the measurement/gauging group (15%).
Survey results show that while high data processing requirements for deep learning present a challenge, our audience has figured it out more often than not. On a scale where one represents a working viable solution and five represents no solution found, 54%of respondents indicated a one or two, 26% were on the fence, and 20% have not yet found a viable solution.
Multispectral/hyperspectral imaging
These hot-topic technologies, according to our survey, are currently used most in the R&D group of respondents (58% currently using with 24% using often and 34% seldom).
At 45%, the OEM/machine builder group uses the technology at the second highest rate (24% often, 21% seldom), followed by systems integration companies at 43% (22% often, 21% seldom).
Oddly enough, however the OEM/machine builder group had 31% indicate that they do not use the technology at all, while 24% may use it in the future. Using these technologies the least amount is the end user/manufacturer group with 33% reporting no use at all.
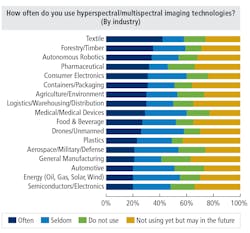
Results show that multispectral/hyperspectral imaging technology is used most often among the following industry groups: textile (42%), forestry/timber (35%), and autonomous robotics (34%). Total use was highest among consumer electronics and medical/medical devices (each with 60%), and forestry/timber at 59%. The plastics group sees the technology as viable in the future however, as 43% may use in the future and a total of 92% are either using or may use going forward. (See table on the right).
Industries using multispectral/hyperspectral imaging the least were automotive and general manufacturing, each with 22%, followed by these groups, each of which had 20% in the do not use column: aerospace/military/defense, agriculture/environment, and pharmaceutical. Interestingly enough, those using multispectral/hyperspectral imaging in the agriculture/environment group value it highly, as 67% of the group indicated that the technology is very important right now. This is followed by the textile group at 64% and the pharmaceutical group at 63%.
Among those in the different application groups, X-ray imaging respondents use multispectral/hyperspectral imaging technology the most often at 44%, followed by the multispectral/hyperspectral imaging group at 41% (oddly enough), and the forensics group at 39%. The X-ray group reported highest total use (76%), followed by the multispectral/hyperspectral imaging group (73%), and the unmanned/autonomous group at 65%. The main groups looking toward potential future use are logistics/warehousing/distribution (41%), guidance/tracking systems (39%), and intelligent transportation (35%). Perhaps surprisingly so, those who indicated do not use the most among the groups are factory automation (29%), forensics (23% - the group who also was third highest in the uses often group), and life sciences at 22%.
The intelligent transportation group find multispectral/hyperspectral imaging very important right now more than any other group at 67%, followed by the logistics/warehousing/distribution group at 57% and the life sciences group at 54%.
Technology challenges encountered when using multispectral/hyperspectral imaging may account for the middling usage rates. Survey results show that, on a scale where one represents no challenges encountered and five represents the most challenges encountered, 35% indicated a one or two, 30% were in the middle, and 35% have the most challenges encountered (indicating a 4 or 5 response). Additionally, on a scale where one represents a working viable solution and five represents no solution found, 49% indicated a one or two, 24% were in the middle, and 27% have not found a viable solution.
(See: Multispectral and hyperspectral cameras expand the scope of industrial imaging, http://bit.ly/HSMSI).
Polarization
Polarization imaging products seemed to make a significant leap in popularity over the last few years, but just how many people use them? According to our survey, a total of 61% of systems integration companies are, with 26% using often and 35% using seldom. This is followed by the OEM/machine builder group at 59%, with 35% using often and 24% using seldom. The R&D, end user/manufacturer, and vendor/supplier groups use it much less, with each group indicating 30%, 39%, and 43% respectively in the do not use category.
However, the R&D community and end user/manufacturer groups indicated at rates of 27% and 22% respectively that they may use the technology in the future.
Survey results indicate that polarization imaging technology is used most often among the following industry groups: semiconductors/electronics and textile at 33% each, and consumer electronics and pharmaceutical with 32% each. The highest amounts of do not use came from the following groups: energy (31%), logistics/warehousing/distribution (28%), and aerospace/military/defense and autonomous robotics, each at 27%. The groups looking toward potentially using it in the future at the highest rates were plastics (29%), general manufacturing (25%), and drones/unmanned (24%).
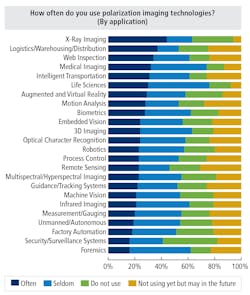
In the groups of different applications (See table below), those using polarization imaging technology the most are X-ray imaging at 44%, logistics/warehousing/distribution at 37%, and web inspection at 34%. The uses seldom had high answer rates as well, with the life sciences group at 46%, medical imaging group at 42%, and infrared imaging group at 40%. Using it the least (do not use), were security/surveillance (41%), X-ray imaging (interestingly enough; 31%), and factory automation and augmented/virtual reality at 28% each. Indicating at high rates that they may use polarization imaging in the future were remote sensing (31%), motion analysis (28%), and process control, guidance/tracking systems, and intelligent transportation, at 26% each.
In terms of importance, the application group respondents indicating at the highest rates that polarization technology is very important right now were logistics/warehousing/distribution at 47%, remote sensing at 40%, and intelligent transportation at 36%. These figures tie in well with the statistics on those who aren’t using now but may in the future. Rates for somewhat important right now were rather high, with 72% in the life sciences group, 70% in the X-ray imaging group, and 61% in the biometrics group all choosing this answer. On the opposite end, not important rates were quite low, with only one group (guidance/tracking systems, 13%), in double digits.
On the scale where one represents a working viable solution and five represents no solution found, 50% indicated a one or two, 24% were in the middle, and 26% have not found a viable solution.
Polarization adoption may rise if potential adopters can overcome the challenges of using the technology. Results on the scale where one represents no challenges encountered and five represents the most challenges encountered, 42% indicated a one or two, 34% were in the middle, and 24% have the most challenges encountered (indicating a 4 or 5 response).
Those familiar with polarization technology, or those who will be in the future, may find that it helps when it comes to the inspection of glossy, reflective, and shiny metal parts. On the challenges encountered scale, 30% of total survey respondents indicated a one or two, 22% were in the middle, and 48% of respondents have the most challenges encountered (indicating a 4 or 5 response) when it comes to these types of inspections.
Embedded vision
Embedded vision technology is used more often than not, according to our survey respondents. More than 50% of all company type groups deploy embedded vision technology, with 39% of the R&D and vendor/supplier groups and 38% of systems integration companies using it often. Despite these numbers, 29% of the vendor/supplier group and 24% of the end user/manufacturer group report not using it at all. R&D respondents reported the highest rate of total usage (defined here as often and seldom) at 65%, followed by systems integration companies at 63%, and OEM/machine builders at 59%.
Vendors/suppliers, systems integrators, and R&D groups find embedded vision technology very important right now at the high rates of 60%, 47%, and 44%, respectively.
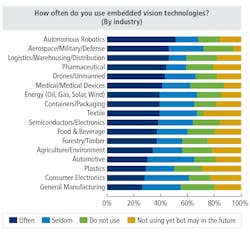
At least 50% of all industry respondent groups use embedded vision technology in some capacity (See table above), led by aerospace/military/defense at 72% total usage. This is followed by the autonomous robotics group (68%), and the energy and textile groups at 67% each. Using embedded vision the most often were the autonomous robotics group (51%), followed by the aerospace/military/defense and logistics/warehousing/distribution groups at 46% each. Considering the deployment of embedded vision technologies in the future at the highest rates were the plastics group (29%), textile group (28%), and consumer electronics group (23%).
Numerous industry groups indicated that embedded vision technology is very important right now at rates of 50% or higher, including pharmaceutical (60%), agriculture/environment (58%), drones/unmanned, plastics, and autonomous robotics (53% each), aerospace/military/defense and logistics/warehousing/distribution (52% each), and energy and textile (50%). Additionally, the remaining 50% of the textile industry group indicated somewhat important right now, meaning that 100% of this group at present finds the technology important.
In terms of the applications where embedded vision technology is deployed most often, the group with the highest response rate was (perhaps obviously) the embedded vision group at 64%. Those within the embedded vision application group also indicated using the technology 20% seldomly for a total of 84% total usage. The next highest rate of using often was the unmanned/autonomous group at 56%, followed by motion analysis at 49%. After the embedded vision group, the highest total usage rates were motion analysis (79%) and unmanned/autonomous (78%).
However, the following groups indicated do not use at a rate of 20% or higher: forensics (23%), life sciences (21%), and machine vision, factory automation, medical imaging, security/surveillance, and measurement/gauging, all at 20% each. High response rates in the not using yet but may in the future group include web inspection (30%), remote sensing (28%), logistics/warehousing/distribution, X-ray imaging, and augmented/virtual reality (25% each).
Application groups that found embedded vision most important right now were intelligent transportation (71%), embedded vision (58%), and unmanned/autonomous (55%). Overall, most find the technology important as nearly every group indicated 0% for not important, while six groups indicated not important at rates of 5% or less.
Two survey questions measured on a scale where one represents no challenges encountered and five represents the most challenges encountered pertain to embedded vision either directly or tangentially. In the technology challenges encountered in embedded vision question, 41% of respondents indicated a one or two, 36% were in the middle, and 23% have the most challenges encountered (indicating a 4 or 5 response). These responses suggest that while some still encounter challenges with embedded vision, solutions have been found in more cases than not.
In the technology challenges encountered in camera mobility in vision systems, such as moving a camera to inspect different locations on large parts or beyond a robot’s reach, embedded vision may come into play because of the inherent mobility and compact sizes usually associated with the technology. In this question, 43% respondents indicated a one or two, 28% were in the middle, and 29% have the most challenges encountered (indicating a 4 or 5 response). More people encounter problems with this particular challenge, but perhaps embedded vision could help going forward.
3D imaging
Company types using 3D imaging most often, according to the survey, are OEM/machine builders at 48%, followed by systems integration and R&D groups at 35% each. 20% of end users/manufacturers and systems integration company groups in the survey reported not using 3D technology at all. More promising, however, is the fact that 26% of R&D, 21% of end users/manufacturers, and 20% of systems integration group respondents may use the technology in the future.
With regards to the importance placed on the technology by the different groups, systems integration companies had the highest answer rate in very important right now at 56%, followed by 47% from the R&D and 38% from the end user/manufacturer groups.
Industry groups using 3D imaging technology the most according to the survey are autonomous robotics, semiconductors/electronics, and containers/packaging, as the groups reported using often rates of 46%, 44%, and 42% respectively, Total use was highest among the semiconductors/electronics group (74% using), and consumer electronics and autonomous robotics groups, each at 72% using.
Indicating non-usage at rates of 20% or more were pharmaceutical and plastics at 21%, and drones/unmanned at 30%. Not using now but considering future use at the highest rates were forestry/timber (31%), containers/packaging (26%), and agriculture/environment (25%).
Numerous industry groups find 3D imaging technology very important right now at rates of 50% or higher, led by the logistics/warehousing/distribution group at 60%, followed by the autonomous robotics group at 58%, and the pharmaceutical, semiconductors/electronics, and forestry groups at 50%. No double-digit responses were registered for not important or not important will be very/somewhat important in the future.
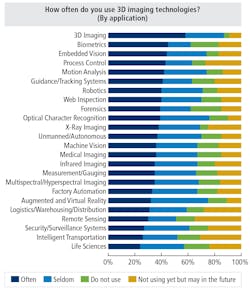
In the application groups (See table above), 3D imaging obviously leads the way in uses most often at 58%, followed by the biometrics group at 45% and embedded vision group at 44%. Also, at 40% or higher were process control (43%), motion analysis (42%), guidance/tracking systems (41%), and the web inspection and robotics groups at 40% each. Though every application group reports total usage at rates of 51% and above, the forensics group reported 23% in do not use, and the biometrics group reported 21%.
Still, there were a fair amount of those not using 3D imaging yet but potentially planning to in the future, led by the remote sensing group at 35%, followed by intelligent transportation at 31%, and logistics/warehousing/distribution at 28%.
Predictably, among the application groups 3D imaging is most important right now for the 3D imaging group at 64%, followed by the guidance/tracking systems group at 59%, and the process control group at 56%. All application groups place value on 3D imaging technology as the only double-digit answer outside of very important or somewhat important right now, was 10% in the not important, but will be very important in the future, for the life sciences group.
Two survey questions relating to 3D imaging technology involve the scale where one represents no challenges encountered and five represents the most challenges encountered. In the technology challenges encountered in random object picking/bin picking question, 41% of respondents indicated a one or two, 33% were in the middle, and 26% have the most challenges encountered (indicating a 4 or 5 response). Additionally, in the technology challenges encountered in random box depalletizing question, 40% of respondents indicated a one or two, 40% were in the middle, and 20% have the most challenges encountered (indicating a 4 or 5 response).
For the most part, the data suggests that while solutions have been found at a higher rate than not, some challenges exist for such scenarios. Many 3D imaging products available on the market today target both applications, some of which could potentially help accomplish the task at hand. Several 3D imaging products are also described in detail in this issue on pages 29 and 33.
Computational imaging
R&D and OEM/machine builder company types use computational imaging technology most often, at rates of 48% and 45% respectively. End users and vendor/suppliers use it often the least at 32%, but still use seldom at rates of 36% and 29% respectively. The highest rates for do not use came from OEM/machine builders (31%)—interestingly enough—and vendors/suppliers (28%). Total usage was highest among R&D groups at 71%, followed by end users/manufacturers at 68%. All groups indicated some form of usage of computational imaging technology at 61% or higher.
Essentially echoing these data points were the figures for the importance placed on the technology by the different groups. Systems integration companies indicated at a rate of 67% that the technology is very important right now, followed by 51% from the R&D group.
Among the industry groups in the survey, computational imaging technologies are used most often among drones/unmanned (51%), autonomous robotics and logistics/warehousing/distribution (49%), and consumer electronics (48%). The other groups have relatively high rates of often use, however, ranging from 35% (medical/medical devices and plastics) to 46% (energy, semiconductors/electronics). Total usage is highest in the drones/unmanned group at 76%, followed by autonomous robotics at 75%, and semiconductors/electronics at 74%.
The highest rate of non-use is in the plastics group at 26%, followed by the medical/medical devices group at 23%, and the energy and pharmaceutical groups at 21% each. Those who aren’t using the technology but may in the future at the highest rates were the containers/packaging group at 24%, followed by the logistics/warehousing/distribution, food and beverage, pharmaceutical, and plastics groups at 18% each. Textile (67%), consumer electronics (61%), and containers/packaging and pharmaceutical (57% each) find computational imaging very important right now at the highest rates.
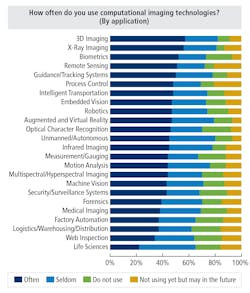
In the application groups (See table on the left), those using it often at rates of 50% or higher were 3D imaging (57%), X-ray imaging (56%), biometrics (52%), remote sensing (51%), and guidance/tracking systems (50%). Thirteen of the 24 groups use it often 40% of the time or more, as well. Using it seldom at the highest rates were life sciences (43%), unmanned/autonomous (35%), and infrared imaging (33%). Several groups, however, had decently high rates of do not use, as the following groups had rates of 20% or higher for this response: factory automation, web inspection, medical imaging, security/surveillance systems, logistics/warehousing/distribution, measurement/gauging, biometrics, and optical character recognition.
The groups using computational imaging the most in total were 3D imaging (82%), X-ray imaging (81%), and unmanned/autonomous (80%). Thirteen of the 24 groups had 50% or higher in the very important right now response, led by intelligent transportation at 64% and biometrics at 60%. No group had higher than 6% in the not important response.
A separate survey question where computational imaging technology could potentially factor into a solution uses the scale where one represents no challenges encountered and five represents the most challenges encountered. In the technology challenges encountered in defect/flaw detection question, 37% of respondents indicated a one or two, 30% were in the middle, and 33% have the most challenges encountered (indicating a 4 or 5 response). These answers are a bit spread out, suggesting that those involved in defect/flaw detection still encounter problems. Computational imaging techniques that enhance image quality or extract certain features could potentially offer help in such cases. Computational imaging techniques are described in further detail on page 15 of this issue.
Total figures and summary
The technology with the highest total rate of use is computational imaging at 67%, followed by 3D imaging (62%), embedded vision (61%) deep learning (56%), polarization (52%) and multispectral/hyperspectral imaging (48%). Used most often at the highest rates is computational imaging at 41%, followed by 3D and embedded vision (41%), deep learning (31%), multispectral/hyperspectral (21%), and polarization (20%). The highest rate for do not use was polarization at 27%, followed by multispectral/hyperspectral (20%), embedded vision (19%), 3D imaging (18%), computational imaging (17%), and deep learning (13%).
The responses for seldom use were close, ranging from 25% (deep learning) to 32% (polarization). The technology which respondents are considering for the future the most is multispectral/hyperspectral at 32%, followed by deep learning (31%) polarization (21%), embedded vision and 3D imaging (20%), and computational imaging (16%).
Despite any marketing hype behind these technologies, this survey of 320 audience members shows that these products are indeed being deployed in the real-world. The amount of people considering future use of the technologies and stating that the technologies will be very important in the future suggests that these numbers are likely to rise, so stay tuned.
This story was originally printed in the November/December 2019 issue of Vision Systems Design magazine.
About the Author

James Carroll
Former VSD Editor James Carroll joined the team 2013. Carroll covered machine vision and imaging from numerous angles, including application stories, industry news, market updates, and new products. In addition to writing and editing articles, Carroll managed the Innovators Awards program and webcasts.
