Computed-tomography-based medical imaging
Computed-tomography-based medical imaging
By John Haystead, Contributing Editor
The Massachusetts General Hospital Center for Imaging and Pharmaceutical Research (CIPR; Charlestown, MA) is a front-runner in functional imaging--an emerging medical-imaging technique that provides both spatial and temporal information within a single image set. Functional imaging furnishes detailed anatomical information and depicts physiological changes, such as blood flow over time, to show how well a particular human organ is functioning.
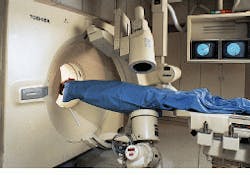
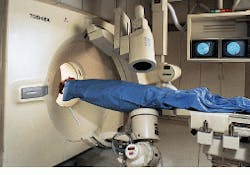
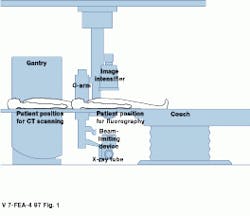
"Medical imaging was once thought of just for diagnostic purposes. Now there is much more interest in beginning the treatment of local disease immediately," declares CIPR director Dr. Gerald Wolf. Real-time functional-imaging technology such as that developed by the CIPR is providing a bridge from diagnosis to therapy. At the heart of the CIPR imaging capability is a custom hybrid imaging system that combines helical-scanning computed-tomography (CT) technology and digital angiographic x-ray processing in one examination station (see Fig. 1).
Digital angiography is an important diagnostic imaging tool for evaluating the extent of strokes or heart attacks. In generating real-time x-ray imagery, angiography systems visualize blood vessels following the introduction of a contrast agent. The CIPR researchers use digital subtraction angiography (DSA) to electronically deduct the background clutter of bone and soft tissue from images. The DSA process also allows radiologists to view the contrast agents in blood vessels. In performing this process, an image of the background is initially acquired as a baseline or mask; then it is electronically extracted from subsequent images in real time.
"The technique shows great promise in evaluating various cancer treatments. In addition to seeing how cancerous tissue has invaded an organ, the flow of blood to the tumor can be measured before and after treatment," says John Cannillo, CIPR administrative director of research. Prior to the advent of such technology, clinicians needed to inject radioactive die into patients to obtain this kind of imaging data.
Advanced scanning
Designed by Toshiba America Medical Systems (Tustin, CA), the angiographic system isolates an area of interest for follow-on advanced helical-scan or single-slice imaging by the CT system. Because two system scanners are integrated into one station, imaging landmarks can be transposed between the two systems.
For example, in the Toshiba single-plane, digital fluoroprocessor (DFP-60) angiographic system, the x-ray tube and the image detector/intensifier are mounted on opposite ends of a C-shaped support arm suspended above the examination table. This support arm is used to rotate both the tube and the detector about the table.
A 14-in.-diameter phosphor screen in the image intensifier converts the x-ray radiation into electrons that are amplified and passed to a second phosphor screen on the back of the detector. This electronic image is then acquired at either 1049 lines at 30 frames/s interlaced or 525 lines at 60 frames/s progressive, according to Dr. Frederick Wagner, Toshiba senior product manager, cardiovascular systems.
Final images can be generated at either 7.5 frames/s (1024 ¥ 1024 lines) or 30 frames/s (512 ¥ 512 lines). Up to 1 Gbyte of image data can be stored on the system disk.
Data collection
After isolation by the angiographic system, detailed anatomical data are collected by the collocated CT scanner. In the Toshiba TCT-900S/X helical-scan CT system, the examination table moves through a circular gantry around which the x-ray tube rotates. Distributed about the gantry`s 360 surface is an array of solid-state cadmium-tungstate crystal detectors that are sequentially excited during x-ray tube rotation. "The detectors absorb x-ray photons at better than 99% efficiency," says Brian Westerman, Toshiba clinical sciences manager for computed tomography.
The x-ray energy is first converted to visible light by the crystal detectors, then collected by a photodiode array, and next converted into electrical signals for amplification and digitization. Lastly, raw digital data from the detectors are combined with stored calibration files in the system`s pipelined array processor to generate final images. The TCT900 also incorporates proprietary processing boards and operating system software, but Toshiba has converted its latest-generation CT equipment to a VME architecture incorporating standard Motorola 68040 processors and UNIX 2.3 software.
Images are reconstructed at 512 ¥ 512 ¥ 16 bits/pixel resolution and require approximately 0.5 Mbytes of memory. Complete data sets range from 25 to 100 Mbytes/set. Because the system`s field of view can be adjusted according to the subject matter, the pixel-per-inch resolution is variable; however, in the CIPR`s applications, detail is typically resolved to 0.35 mm. Under operator control, filtering algorithms determine the sharpness and smoothness of the displayed images.
The CT system can be operated in either dynamic single-slice or helical-scan mode. In single-slice mode, the table remains stationary and images the same slice repeatedly over time. In general, says Cannillo, dynamic data sets are sampled once every second for the first two minutes and track the changes in x-ray beam attenuation through the subject.
System software then retroactively reconstructs each image set into smaller time frames to increase its temporal resolution. For example, whereas a 1 scan/s for one minute provides 60 images per slice, the system extrapolates each of these original images at 200-ms intervals to produce a total set of 300 images, five images from each original. This process provides a smoother overall plot of the image data curve.
Helical scan
In helical-scan mode, the patient table moves laterally within the x-ray gantry while the tube is rotating. "This allows continuous, multi-image data sets to be acquired from which can be generated a single static image, or map, reflecting all of the anatomical changes that have occurred over the time frame," notes Cannillo.
To view multiple slices using a conventional CT scan system, radiologists stop the machine and reposition the table and patient between each imaging step. "In addition to being time-consuming, this procedure requires the patient to be immobilized. In some cases, important anatomical details can be missed between slices," remarks Westerman. "In contrast, helical scanning provides a continuous top-to-bottom scan of the entire area of interest, collecting in 30 s what would have taken 10-15 minutes," he adds. Such helical-scan systems also reduce the patient`s total radiation exposure.
In helical-scan mode, a trade-off must be made between table motion and scan time. Declares Westerman, "Because we`re not getting a full 360 data set for each slice, the computer interpolates the rest of the image from prior and subsequent data sets. Therefore, if the table is moved faster, the imaging algorithms need to do a lot more interpolation because less data are acquired."
Image processing
At the CIPR, image analysis is performed off-line from the CT and angiographic systems on one of seven Macintosh PowerPC 8500 platforms that are networked via an Ethernet local-area network to a Sun Microsystems (Mountain View, CA) SparcStation 10 server (see Fig. 2). With this network, multiple researchers can simultaneously access the same data and transfer data from the server to their own 2-Gbyte external hard drives.
To process images, the PowerPCs run DIPStation and Alice image processing and analysis software packages from Hayden Image Processing Group, a division of Perceptive Systems (Boulder, CO). In addition, CIPR researchers have developed image-analysis software modules for similarity mapping, normalized correlation, thresholding, and Region of Interest functions.
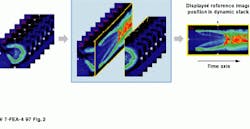
Similarity-mapping reduces the dynamic image sets to a single picture, in which the time-history of every pixel in the data set is correlated against a reference region know to contain a functional abnormality (see Fig. 2). This process differentiates those patient tissues that present a functional performance close to that of the abnormal region from the rest of the structure, thereby allowing clear segmentation of abnormal and normal tissues. For a typical image set of one hundred 256 by 256 images, a similarity map can be calculated in 12 s using the Alice software. It is also possible to display several maps on one composite image using multicolor lookup tables.
While similarity mapping is relatively straightforward for single-slice image sets, three-dimensional (3-D) volumetric analysis proves more difficult because fast helical-scan CT scanners generate multiple time histories, one for each slice imaged. Whereas one slice of dynamic study is composed of 50 temporal images, a 15-slice volumetric study consists of 750 images.
To address this problem, CIPR`s Dr. Ika Rogowska, assistant in medical imaging, has developed computational procedures that extend the similarity-mapping techniques to volumetric, four-dimensional (3-D and time), dynamic image data sets. The procedure enables the definition of 3-D regions with similar or dissimilar temporal patterns with respect to a reference voxel or 3-D reference volume of interest.
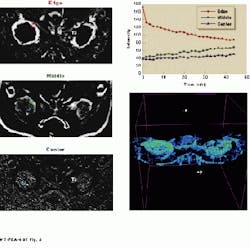
The interactive software environment allows the analysis of structures that possess complicated functional behavior and provides a 3-D display of spatial relationships to other organs or image regions. By observing relative blood-volume, transit-time flow maps, clinicians can determine how quickly contrast agents are arriving at specific organs. "The technology is of interest to clinicians as a noninvasive way to evaluate cancer treatments," states Rogowska (see Fig. 3).
FIGURE 1. Combining both digital angiography and CT scanning in one system allows differing data sets to be correlated, providing a more accurate means of diagnosis.
FIGURE 2. Axial slices of rabbit kidney show the changes over time after a contrast agent is injected. The image on the right summarizes in one static image all the changes that have occurred.
FIGURE 3. A 30-min helical data set of a cancerous tumor taken eight days after partial treatment with magnetic resonance focused ultrasound shows the three identifiable tumor regions, from outside (well-perfused) to inside (poorly perfused). A 3-D correlation map of the same tumor is also shown with the top six slices of the 13-slice data set removed to show the internal tumor structures. Volume rendering was performed using ray-tracing.
