Critical Caps
Andrew Wilson, Editor
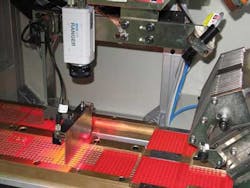
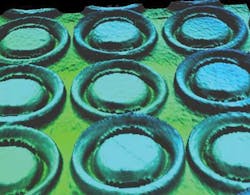
Percussion caps are a critical component used in manufacturing ammunition. Produced in mass quantities, these explosive caps must be fabricated with strict tolerance requirements and inspected with 100% accuracy. A leading producer of hunting cartridges has approached Dr. Alberto Tellaeche of the Tekniker Foundation Technological Center to develop an automated system that can inspect these parts at rates as fast as 216,000 units/hour. The system inspects plates containing 600 percussion caps per plate to achieve these rates as the caps are presented to the system along a conveyor (see Fig. 1).
“Many different errors can appear during the production of these percussion caps,” says Tellaeche. “For example, the central part of the cap may be dented, badly mounted, inverted, or mounted above or below the correct tolerance in the plate. Other errors may include missing caps or dirty caps.” Previously, this inspection was performed manually with statistical samples being extracted at random for analysis by a human inspector.
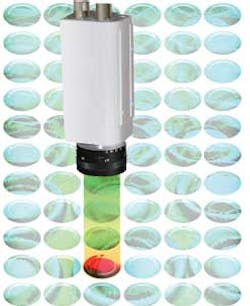
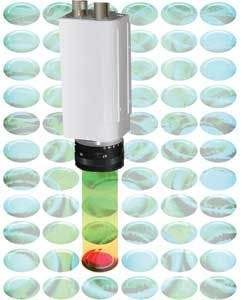
To perform the in-plate inspection of the percussion caps, Tellaeche and his colleagues realized that it would be necessary to capture both 2-D and 3-D images of the parts as they moved along a production line. By deploying a structured 3B class line-projecting red laser beam for the 3-D image acquisition and a diffuse red barlight for the 2-D image acquisition, images could be captured using a Ranger E55 camera from Sick.
The system designers divided the sensor in the camera in different zones, enabling the camera to simultaneously capture 512 × 3300 × 8-bit 2-D images and 512 × 3300 × 16- bit 3-D images. The 35k line profiles generated per second were then transmitted over the camera’s GigE interface to an Intel Core 2 Quad Q9550 CPU running at 2.83 GHz.
“Because the system must be capable of inspecting a plate containing 600 percussion caps in less than 8 s,” says Tellaeche, “the Halcon 9.0 Machine Vision library from MVTec was chosen because it is fast and image-processing functions can be parallelized across the four cores of the processor.”
Different image-processing algorithms are used on the individual 2-D and 3-D images generated by the Sick camera (see Fig. 2). In each of the images, five regions of interest (ROIs) are generated corresponding to the five groups of 120 percussion caps present in each plate. Within each ROI, a model finder operation is performed using a synthetic model of a percussion cap based on geometrical shape. Using this model finder, all the percussion caps in the images can be perfectly located and further image-processing functions performed.
For each of the percussion caps present in the 2-D image, a threshold and a blob analysis of the central capsule are performed. Post-thresholding, the circularity of the central capsule is determined. After circularity is calculated, the area of the central capsule is determined using blob analysis.
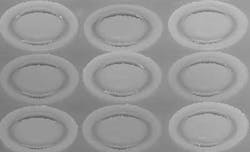
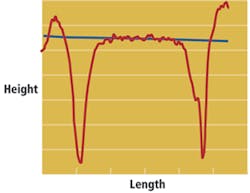
To complete 3-D image processing, six line profiles are programmed for the analysis of each percussion cap—three horizontally and three vertically. Due to the nature of the imaging system, each percussion cap has an elliptical shape, so the parameters of the line profiles differ depending on the type of line profile—whether they are horizontal or vertical. Because of irregularities in the plate containing the percussion caps and the errors in the positioning of the pieces, the profile obtained may not be perfectly horizontal in the central part (see Fig. 3).
After line profiles are generated, the width of the central capsule is determined from the position of the maximum and minimum points of the line profile at the beginning and end of the percussion cap. Errors related to the fabrication tolerance of the caps are determined by comparing the height values of the central capsule and the values of the borders of the external capsule. Other errors are determined by calculating the divergence of the height values of the percussion cap’s central capsule.
Using statistical analysis, a regression line of the values corresponding to the central capsule of the percussion cap can then be calculated. From this regression line, the height values that the central capsule should exhibit can be estimated and the tolerance determined. By using the slope and bias of the regression line, the system can determine whether the central capsule of the percussion cap or the cap itself is missing.
To determine whether the central capsule is mounted above or below tolerance, the differences between the two maximum values of the percussion cap and the theoretical value of the regression line are used. If this mean value is small and within the tolerance permitted, the central capsule is passed as a good part; if larger, then the capsule is mounted below tolerance and is rejected.
“Replacing the need for statistical manual analysis of percussion caps has resulted in an automated system capable of inspecting 100% of every cap,” says Tellaeche. “Statistically, this means that the system will only make three possible errors out of every 100,000 percussion caps that are inspected.”
Company Info
MVTec SoftwareMunich, Germany
Sick Waldkirch, Germany
Tekniker Foundation Technological CenterEibar, Spain
