Advanced Visualization Method Improves Understanding of 3D Point Cloud Data
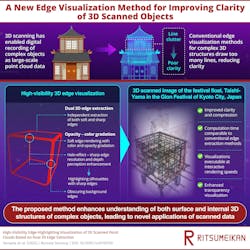
Researchers have developed a method of visualizing scanned 3D point cloud information that reduces visual clutter, improving resolution and depth perception.
With advancements in 3D scanning, it has become possible to record visual information about very complicated objects as 3D point cloud data. “That said, the recorded point clouds often amount to billions of points, making them massive datasets,” explains Satoshi Tanaka, professor at the College of Information Science and Engineering at Ritsumeikan University (Kyoto, Japan), and one of the lead researchers. “New visualization technologies are required to handle such data effectively,” he says.
Tanaka and the other researchers say conventional edge-highlighting visualization methods, which emphasize an object’s sharp edges, lead to excessive line clutter. Conventional methods also provide inadequate information about soft (smooth or rounded) edges, they write in an article they published in Remote Sensing (bit.ly/4g3FaKQ).
For example, wall reliefs in temples often contain more soft than sharp edges. That is why a visualization comprised of only hard edges will not represent these artifacts adequately, the researchers write.
Related: Researchers Discover Ancient Drawings in a Cave Using Photogrammetry
The edge-highlighting method they propose is designed to produce better results. It can be applied to any 3D-scanned point cloud data and is particularly useful for very complex shapes or structures. “Our edge-highlighting method can visualize both sharp edges that represent global structures and soft edges that represent local structures. This is beneficial regardless of the object being visualized,” says Tanaka.
Applying Visualization of Point Cloud Data to Cultural Artifacts
However, Tanaka adds that their method could be particularly useful the visualization of culturally significant buildings and artifacts.
Traditional methods of documenting these artifacts—such as videos, photographs, and hand-drawn illustrations—are limited in the amount of detailed information they capture, compared with scanned 3D point cloud data, Tanaka notes.
“Large-scale cultural sites often possess highly complex three-dimensional structures. Moreover, these structures frequently include internal components. Our high-visibility edge-highlight visualization, which is also well-suited for transparent visualization, is ideal for analyzing such complex external and internal three-dimensional structures,” he explains.
The researchers use a technique that emphasizes both the hard and soft edges of an object. To achieve this, they utilize two feature value thresholds—one for soft edges and another for hard edges—in their calculations.
Related: Artist Gives 19th Century Sculpture 21st Century Perspective with 3D Imaging
They also apply gradation to both the color and opacity of an object’s soft edges, which enhances them. “This gradation achieves a comprehensive display of fine 3D structures recorded within the soft edges,” they write in the journal article.
Using the gradation also leads to the “halo effect,” in which a glow around the sharp edges improves depth perception, they add.
Meanwhile, sharp edges are highlighted with constant opacity and color.
Comparing Performance of Visualization Methods
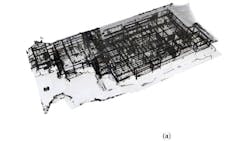
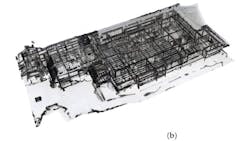
The researchers compared the results produced by the two methods on point cloud data of the Tamaki Shinto Shrine Office Building in Nara Prefecture, Japan. They found that their method shows the building’s internal rooms in clearer detail than the standard method. They also found that the computation time involved for the two methods was comparable.
They also demonstrated the performance of their novel method on scanned point cloud data from other cultural heritage objects such as the wall reliefs in the Borobudur Temple in Indonesia and the rooms and Buddha statues in the cave of the Zuigan-ji Buddhist temple in Miyagi Prefecture, Japan.
Related: Smithsonian Creates 3D Model of Mammoth, Other Historical Artifacts
In summarizing their work, the researchers write, “We demonstrated that the total 3D structures of real-world objects can be effectively represented by using both sharp and soft edges extracted by our dual 3D edge extraction. Therefore, our 3D edge extraction is not merely an improvement of conventional methods but rather an extended technique that captures areas not covered by traditional methods.”
About the Author
Linda Wilson
Editor in Chief
Linda Wilson joined the team at Vision Systems Design in 2022. She has more than 25 years of experience in B2B publishing and has written for numerous publications, including Modern Healthcare, InformationWeek, Computerworld, Health Data Management, and many others. Before joining VSD, she was the senior editor at Medical Laboratory Observer, a sister publication to VSD.


