Blade Scanner
C.G. Masi, Contributing Editor
Finding flaws inside fiber-reinforced plastic (FRP) wind-turbine blades is important to organizations charged with keeping wind turbines running and making electricity. They can be owners of wind farms, wind-turbine producers and installers, or even specialized crews providing turbine-blade inspection as a service. To meet this need, Automation Technology (AT) has developed a lock-in thermography imaging system for nondestructive testing (NDT) of these composite structures.
FRP is a composite material in which highly inelastic fibers, oriented to resist tensional loads, are “laid up” in layers held together by a thermosetting plastic (such as epoxy resin) matrix. Fibers in various layers have different orientations to resist differently oriented stresses. For example, there will be layers with fibers running directly from a wind-turbine blade’s root to tip to resist centrifugal forces. Other layers will have fibers running diagonally to resist twisting forces. The plastic matrix carries compression and shear stresses between fibers, forcing them to work together to achieve the desired mechanical properties.
Delaminations arise when the plastic matrix fails under shear loads between fiber layers. This may be caused by the matrix failing directly, or by fibers failing and increasing the shear stress on the matrix surrounding them, which causes it to fail in turn. In any case, the result is a flat crack parallel to and at some depth beneath the blade’s surface.
These flaws form weak spots that cause stress to concentrate in the unbroken plastic at their margins, so they tend to grow over time. Each time the load peaks—for example, due to a wind gust—the crack advances into previously unbroken material, further weakening the blade. After many load cycles, the blade weakens to the point where it fails catastrophically.
AT’s customers use the company’s lock-in thermal-wave inspection system to evaluate the FRP skin’s condition on an ongoing basis and as a failure-analysis tool.
The technique utilizes a phenomenon called thermal waves, which can be set up by depositing heat at the material surface in a time-varying fashion. The thermal-wave phenomenon exploits a similarity between the general diffusion equation
Both equations have solutions when driven by a sinusoidal forcing function
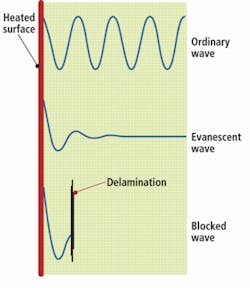
Thus, a sinusoidally varying source depositing heat on the surface of a turbine blade will set up evanescent heat waves. When the heat deposition is high, the surface temperature rises rapidly and heat soaks into the material, raising the temperature beneath. As the heat source cools, however, the temperature at the surface cools rapidly, pulling heat back out of the interior and setting up a heat wave.
Evanescent waves
If it were an ordinary wave, over time a standing wave would build up with constant amplitude through the material’s thickness. Being an evanescent wave, however, by the time it has reached one wavelength in, its amplitude is drastically reduced. Should the wave encounter a crack or delamination, its penetration is even more drastically reduced because the heat cannot penetrate past the broken surface.
AT uses high-powered halogen lights to deposit heat on the turbine blade’s surface at a constant rate depending on the lamps’ power level, the area illuminated, and the surface material’s infrared emissivity. The system sinusoidally modulates the light amplitude to excite a heat wave. The heat-wave amplitude depends on power rate, the material’s specific heat, and the amount of material in the affected zone.
While heat continually soaks in, raising the average temperature of the blade material, the heat wave is a disturbance riding on top of that average level. So, the temperature measured at the surface becomes the sum of a monotonically increasing function of time and a sinusoid with constant amplitude.
When a delamination or crack is buried less than one wavelength below the surface, the heat wave is blocked and thus affects less material. Its amplitude therefore becomes larger. This effect can be measured at the surface.
A thermal imaging camera mapping the surface temperature at a frame rate much faster than the light modulation rate will see a delamination “shadow” as an area where the temperature-oscillation amplitude is higher than that of the surrounding area. The relative amplitude increase provides a measure of the depth of the delamination. A similar technique called transient thermography uses a pulsed heat source to excite heat waves but is more susceptible to interference from environmental effects.
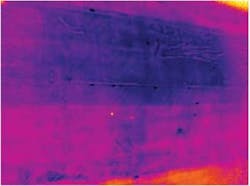
AT has developed software to compare thermal images in a long sequence to map the temperature-oscillation amplitude as a function of position over the inspection area and convert that amplitude to depth below the surface. The system’s final output is an image showing any delaminations within the measurement range, with the delamination depth coded by either color or gray level. Cristian Ferber, applications engineer at AT, says he personally prefers grayscale displays, but many of his customers expect pseudocolor images.
If there are no delaminations in the imaged area, the image shows a uniform light gray. If the measurement range is, say, 2 cm, delaminations appearing farther in will be indistinguishable from solid material. A delamination at a depth of, say, 1.5 cm will appear as a slightly darker patch of gray. A delamination only 1.0-cm deep will appear much darker, and one only 0.5-cm deep will appear darker still.
How deeply into the material the technique can see depends, of course, on the wavelength, which equals the product of the wave speed in the material and the heat source’s variation (i.e., the forcing function) frequency. The wave speed in turn depends on the ratio of the material’s thermal conductivity to its specific heat, which are both constants for the material. The wave speed is thus also a material constant. To look more deeply into the material, engineers need only lower the frequency.
As one can imagine, however, for thermal waves attempting to penetrate FRP, frequencies are down in the sub-millihertz region. At such frequencies, it makes more sense to think in terms of the period (2π/ω). The period of a 1-mHz wave is about 15 minutes, which provides a penetration depth of only a few millimeters. To reach penetration depths of many centimeters requires very long test periods.
The penetration depth attainable in a test is thus constrained by how much time can be practically devoted to making the test. To reach greater depths requires spending more time acquiring data.
Noise, noise, noise
On time scales of tens of minutes and longer, the outdoor thermal environment is fairly noisy. Wind gusts, heating from direct solar irradiation, and solar heating variations due to intermittent cloud cover all add significant noise to the sinusoidal forcing function. To maximize the signal-to-noise ratio (SNR), AT engineers have employed a signal-analysis technique called lock-in detection, which they implemented in software.
Lock-in detection relies on the fact that if you multiply two sinusoidal signals together, then integrate their product over an infinite time, the resulting signal amplitude is a Dirac delta function (also called an impulse function) of the difference in frequency between the two signals. This technique, called convolution, makes it possible to pick out a particular signal in a noisy environment. The convolution integral equals the product of the two signals multiplied by a delta function.
Scientists and engineers have used the convolution integral as the basis for (among other things) Fourier transforms, resonant filters, heterodyne and superheterodyne radio receivers, and lock-in detectors. Practical implementations generally combine an incoming signal (such as a thermal-wave signal) and a locally synthesized comparison signal at the frequency of interest. Lock-in detection’s ability to separate waves at the forcing-function frequency from out-of-band noise makes it possible to improve lock-in thermography’s SNR.
In AT’s turbine-blade inspection application, the lock-in detector is implemented in software. An infrared camera collects thousands of images of the surface temperature pattern in an approximately 1-m2 area on the turbine blade during a test session. The frame rate is typically on the order of 1000X the forcing function frequency, so the total number of images is roughly the number of forcing cycles in the test times 1000. The amount of image-storage memory is thus another practical constraint on how deeply engineers can look into a turbine blade and how precisely they can pinpoint a defect’s depth.
The AT software, named IrNDT, multiplies the temperature of each pixel in each image times the forcing function value at the instant the image was taken, then adds the result to a memory location for that pixel. After repeating the process for every image in the data set, the computer holds a map of the convolution integral for each pixel in the image.
Random environmental influences do not correlate well with the forcing function, so they have little influence on the map. Thermal waves, however, correlate strongly with the forcing function and thus strongly influence the map. Stronger thermal waves produce larger integral values.
After subtracting a gray level and rescaling to fill the dynamic range, the result is an image of the turbine blade with a more-or-less uniform background level and darkened islands outlining cracks and delaminations. The closer a flaw is to the surface, the darker it appears. Grayscale levels can also be translated into false color maps coding depth against a spectrum (see Fig. 2).
null
Making it real
The technique starts with engineers specifying approximately seven test areas at critical positions on the turbine blade. They predetermine test parameters, such as modulation periods, frame rates, and acquisition durations, tailored to each particular area to be inspected. If these sample areas show no defects, the blade passes. If any defects are found, additional inspections covering more of the blade might be called for. Damage severity depends on the size and location of defects found. For example, a small delamination at the blade root, where both flexural moments and tensile forces are highest, might be more serious than a much larger void at the tip, where stresses are relatively small.
Wind turbine blades are made by encasing a relatively light core, which determines the overall blade shape, in a sheath or skin made of FRP, which carries the bulk of the stresses. This skin tends to be thicker near the blade root, where forces and momentum are largest, and thinner farther along the blade. Thus, modulation periods and acquisition times tend to be longest near the root. Frame rates, however, tend to be controlled by the available image-acquisition memory. Generally, engineers want to acquire as many images as possible at each test location, so they usually fill up the available memory for each test. So longer acquisition times call for lower frame rates.
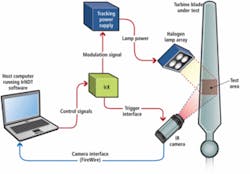
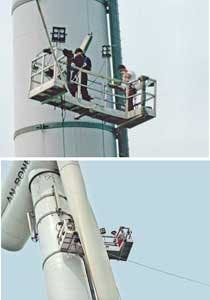
The IrNDT software allows engineers to load the entire test procedure, including sample-area locations and the test parameters for each area, into computer memory. Technicians can then mount the test set, consisting of the computer, halogen lamp assembly, infrared camera, and support electronics onto a movable platform attached to the wind turbine (see Fig. 3). The platform provides 360° access around the blade. Moving the platform up and down the turbine support mast allows them to reach the entire blade length (see Fig. 4).
null
To set up the test, they aim the lamp assembly at an angle to the blade surface and aim the camera normal to the blade. Thus, the camera has a direct view of the blade with no projection effects and avoids specular reflections of the lamp from the blade’s smooth surface. This arrangement allows the camera to monitor surface temperatures across the test area while the lamp assembly heats it more or less uniformly. The slight variation in heat rate caused by blade-surface curvature is predictable and easily compensated by the IrNDT software.
The software controls the acquisition through a proprietary interface called the IRX-Box. It generates trigger signals for the camera, and an illumination power-level signal for the lamp-assembly power supply (PowerBox). The camera returns acquired images through a standard digital video interface such as GigE or FireWire.
Because wind-turbine installations vary so much, AT builds what amounts to a semi-custom system for each installation. They have designed the IRX-Box, for example, to accommodate most IR camera models and specify the camera interface to match the camera selected. The company so far has more than 200 installations in the field.
“This method works very well for detecting defects near the surface,” Ferber points out. “Users typically detect defects as deep as 10–15 mm below the surface. If you want to see defects that are deeper into the material, you have to do measurements over a longer period of time. At some point, the measurement time becomes so long that it’s not worth doing. For lock-in measurements, typical measurement times would be between 30 sec to 5 min depending on what you want to achieve. You can do measurements over a half hour and you would see defects that are deeper in, but imagine if you have to cover an area of so many square meters! With 5 min you could reach about 10 mm.”
The technique’s main advantage is that it can cover large areas in one measurement and routinely check condition of many blades rapidly. Also, the equipment is easily transportable from one turbine to another. A third advantage is that lock-in thermography is less affected by external influences such as sun and wind, so blades can be checked in situ, with no need to dismount them and bring them into a shop.
Finally, software control allows engineers to predefine a test procedure for a given blade type, then have technicians use it for routine monitoring of many blades of that type. The engineers can then concentrate on failure analysis of blades found to be running into trouble.
Company Info
Automation Technology
Bad Oldesloe, Germany
www.automationtechnology.de
