Quality Numbers: Six Sigma
Customers benefit when machine vision is teamed with a process-improvement program that guarantees products with nearly zero defects
Six Sigma is a set of practices originally developed by Motorola in the mid-1980s to systematically improve customer satisfaction by eliminating defects. The basic premise of a Six Sigma program is a metric-driven approach to the business that focuses on process improvement through variation reduction. It has been embraced and adopted by many other companies and businesses in the two decades since it was first developed.
Six Sigma has become the language of business. This is a good thing for the machine-vision industry. Vision is being installed by manufacturers as a measurement or process-control tool to achieve results from their Six Sigma programs. As a result, vision has lost its stigma as a non-value-added, end-of-line inspection tool. It is seen as critical to success by providing process feedback and error prevention for guaranteed products with nearly zero defects.
As manufacturers become educated in Six Sigma principles, they are requiring that their equipment also be Six Sigma capable. Vision suppliers and integrators will need to learn how to use the tools and metrics to meet customer requirements. While this might sound like a daunting task, in-depth training and certification in Six Sigma are not necessary. The quality tools and metrics that comprise the program are not new or particularly difficult to master. However, the discipline to use them at the correct time is important.
The best reason to use Six Sigma is that it works. Even if you don’t care about or use the official Six Sigma program, the quality and statistical tools will enable you to design and build equipment that meets customer needs with a known measurable performance. It can prevent the delivery of a system that would require extensive field-service support. Finally, providing this capability results in a standard, universal format that will delight customers and could provide a competitive advantage.
Windshield project
Six Sigma is comprised of quality tools, statistical metrics, and program-management principles (see “Six Sigma explained,” p. 34). One example is a Six Sigma project to reduce wind noise and water leaks in automotive windshields.
Fixed glass is adhered to the flange of the front opening of the vehicle body with a tall bead of urethane epoxy. If there is a break in the interface between the glass and the sheet metal, it creates a site for water or wind to enter the vehicle. While there are several potential root causes for this type of defect, the urethane bead itself is the most likely cause. Six Sigma was used to identify the root cause of the problem and came up with a vision inspection system as a process-control solution.
The urethane is extruded by a volumetric metering pump into a continuous bead along the edge of the glass with a triangular cross section. The bead has a height requirement of 14 ±2 mm and width of 8 ±1 mm. The bead geometry was manually measured by an operator several times per shift. It was decided to develop and install an in-line vision gauge to increase the frequency of data collection for better process control. Six Sigma quality tools were used during the development of the gauge along with Six Sigma metrics to qualify the capability. A review of the results shows how valuable the program can be in developing capable equipment.
The first phase of a Six Sigma program is to define customer requirements. Since this program has the vision gauge as the deliverable, the team looked at which features were critical to the customer (an assembly plant). These are called critical to quality, or CTQ:
- Measurement accuracy: gauge R&R to be 10% of process tolerance
- Robustness: tolerate changes in appearance, acceptable level of false rejects
- Reliability: no failures over time, hardware and software
- Usability: provide process data for SPC, easy to troubleshoot and fix.
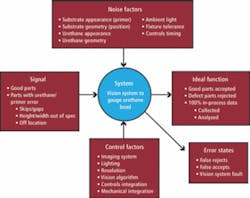
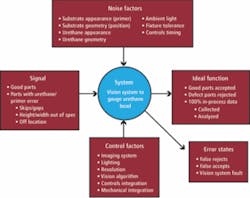
During the next phase, the system inputs which CTQ features were analyzed. This was done with a tool called the parameter diagram, or P-Diagram. The P-Diagram looks at inputs and outputs of the system and categorizes them. The inputs are the signal, control factors, and noise factors. Noise factors are inputs to the process that cannot be controlled but must be contended with. Control factors are the inputs that can be used to optimize the system. The outputs are ideal function and error states (see Fig. 1).
FIGURE 1. In a Six Sigma program to reduce wind noise and water leaks in automotive windshields, a P-Diagram is used to look at inputs and outputs of the production system and categorize them.
The P-Diagram is a good upfront tool to direct the development of the vision solution. It guides the developer to look not only at anticipated inputs, but all factors that can influence the performance of the system. For a vision application, you must consider the environmental factors and provide adequate robustness in the integration. For example, filters or shrouding can be used to reduce the impact of ambient lighting. You also need to consider variations in the product being inspected, even out-of-tolerance conditions. There is usually more than one unintended output or error state. The system should be programmed to not only fail the defective part, but also identify the cause of failure. Providing process information will increase the value of the system to production.
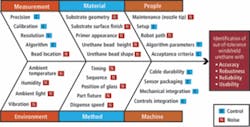
The Cause & Effect (C&E) Diagram, also known as the Fishbone, or Ishikawa, is another useful tool for identifying which input factors are important to the process. The input factors are analyzed in more detail and categorized by the six Ms: measurement, material, man, methods, machine, and Mother Nature (environment). For a measurement device such as this vision gauge, the incoming material, environment, and method are all noise factors. The vision system must be able to accommodate variations in the noise factors and still provide true and accurate answers. The noise factors are mitigated by robust system design taking advantage of the control factors (see Fig. 2).
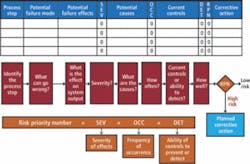
The C&E diagram flows naturally into the Failure Mode & Effects Analysis (FMEA). This is a disciplined technique that is used for evaluating the process, step by step. Potential areas of failure are identified. These failure modes are ranked on the impact of the failure; the rate at which it would be expected to occur, and how likely it is to be detected by the controls in place. These three rankings are multiplied together to generate a risk priority number, which directs the design team where to implement corrective action or necessary controls to prevent or minimize the risk of the failure mode (see Fig. 3).
The FMEA is a living document that gets refined as the system is designed and implemented. Upon completion of the vision application, the FMEA is a good troubleshooting document, leading the user to potential root causes for failure modes. Delivery of a completed FMEA with the equipment installation was a requirement of this project. This is probably one of the most useful tools for designers to identify issues early so they can be designed out of the product.
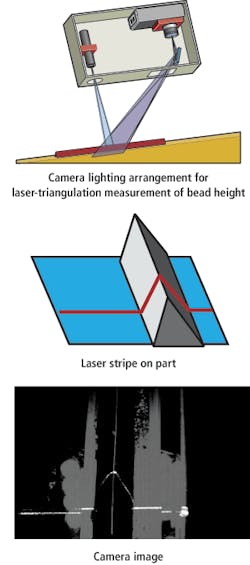
FIGURE 4. Since height, width, and location of a 3-D feature were required, a laser gauge using triangulation for urethane-bead height was necessary for the vision solution.
The upfront analysis of the problem and customer requirements helped the windshield-project team to determine the vision solution approach. Since height, width, and location of a 3-D feature were required, a laser gauge using triangulation for height was necessary. The team decided to use multiple stationary gauges to inspect fixed points along the glass, rather than continuous measurement of the bead following the dispense unit. While this does not provide data on potential skips between camera locations, it is a simpler, less complex approach that still met customer requirements (see Fig. 4; see Vision Systems Design, Sept. 2007).
Applied lighting
The accuracy requirement for the gauge was 10% of the process tolerance. This translates to a gauge tolerance of ±0.2 mm for height and ±0.1 mm for width. A standard gauge capability study was performed. Ten windshields were measured six times each. The data were entered into a statistical software package, Minitab, and the results showed that while the vision algorithm was capable for height, it was not repeatable for width.
Upon closer investigation of the images with respect to the algorithm, we saw that the feature used for identifying the edge of the bead was a single pixel on each side of the bead. Multiple pixels from the laser stripe were available on the top edge of the bead so that some averaging was available to provide subpixel accuracy. However, the width could only be determined to ±1 pixel on each side.
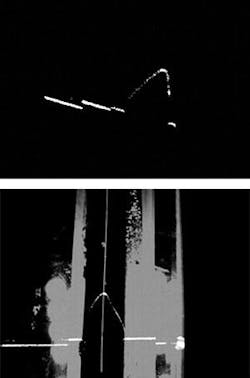
The solution was to add front lighting to the system. An LED light was installed above the part. The new image had gray-scale data to identify the edge of the bead, while the laser stripe was still available to profile the shape of the bead. A caliper tool that averaged multiple edge pixels was implemented to calculate bead width. The gauge capability study was rerun, and the error was reduced to an acceptable level (see Fig. 5).
FIGURE 5. After analysis, front lighting was installed to help identify the edge of the urethane bead.
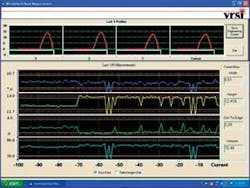
Consideration was given to the need to provide SPC data for long-term control of the urethane-bead dispensing process. All measurement data were stored in a date- and time-stamped file in .csv format for easy import into any data-analysis software. We provided run charts for the previous 100 parts on the operator screen, along with bead profiles of the previous four parts (see Fig. 6).
FIGURE 6. The operator interface screen displays SPC data for long-term control of the urethane-bead dispensing process.
Six Sigma was an integral part of this vision application. A Six Sigma DMAIC process-improvement project first identified that machine vision could be a solution for process control in the dispensing of urethane epoxy. Six Sigma tools were then used for developing the vision gauge, and Six Sigma metrics were used to demonstrate capability.
Additional information on Six Sigma can be found at the Motorola University Web site, www.motorola.com/motorolauniversity.jsp, the Inside Six Sigma Web site, www.isixsigma.com, as well as multiple other sources.
Valerie Bolhouse, a Certified Six Sigma Blackbelt, was formerly a vision specialist at Ford Motor Company. She has presented five Vision Systems Design Webcasts on the Fundamentals of Machine Vision, available on demand at www.vision-systems.com.
Six Sigma explained
While the Six Sigma tools and methodologies have been around for a long time, the systematic application and the practical implementation of them for process improvement are new. Six Sigma is based on statistical thinking:
- All work is accomplished by a process.
- Variation exists in all processes.
- Data can be used to understand and reduce variation.
Six Sigma metrics include sigma or Z-score, process capability (Cp, Cpk), defect rate (defects per million opportunities, DPMO), and yield. Sigma and process capability are measures of process variability relative to specification limits, while defect rate and yield are pass/fail attributes. (Refer toVision System Design Web site for a description of Six Sigma metrics.)
http://www.vision-systems.com/display_article/316149/19/none/none/SPFEA/The-math-behind-Six-Sigma-metrics
The key steps in a Six Sigma process improvement program are Define, Measure, Analyze, Improve, and Control, often referred to by the acronym DMAIC (di-may-ick).
Define. During the Define phase of a Six Sigma project, customer-satisfaction goals are established. Tools such as Process Mapping, Quality Functional Deployment, and Voice of the Customer are used to identify which aspects of the process or product impact customer satisfaction. Quality improvement is pursued only where it will have an impact on customer satisfaction or profitability. A cross-functional team is developed, and project-management tools are used throughout the project to ensure an efficient, systematic march to meet the end objective. The Define phase of a Six Sigma project is a primary differentiator between Six Sigma and other quality improvement programs.
Measure, Analyze, Improve. These three phases are often done iteratively until the project’s quality-improvement goals are met. It is during these steps that machine-vision systems are frequently deployed to provide data on the process parameters and to analyze the impact of the process-improvement actions on quality.
During the Measure phase the baseline performance of the process is measured and benchmarking performed. Defect reduction goals are set from the baseline process capability. The Parameter Diagram and Cause & Effect Diagram are useful for identifying which process parameters should be monitored for improvement. The Failure Mode & Effects Analysis (FMEA) looks deeper into potential failure modes to identify corrective action up front before the system design is completed.
Cause & Effect diagrams and FMEAs are effective in breaking down the process into sub-processes to identify critical areas where machine vision can be employed. These tools naturally drive the point of inspection upstream, rather than at the end of the line. This follows the conventional wisdom for inspecting early. Also, this philosophy leads to the use of multiple, smaller systems, such as smart cameras throughout the process rather than one large, all-encompassing vision system at the end of the process. Six Sigma philosophies are driving the 12.7% annual growth in smart cameras, more than double the rate of growth of the application-specific vision systems (source: Automated Imaging Association 2006 Market Study).
Measurement and analysis techniques are needed to provide control charts and statistical process control (SPC) data to benchline the performance to target and validate process-improvement actions. Design of experiments, simulation, and optimization are used to identify the factors that have the most impact on improving quality. If a noise factor that adversely influences output quality cannot be mitigated, then machine vision can be used to identify and remove the defective part from the process and alert the operator to fix the source of error.
At the conclusion of the Improve phase, the team will have identified and implemented the best alternatives for improving the process and validated the improvements. In a Six Sigma DMAIC project, the improvement is measured and verified with data. Analysis techniques show the improvements to be statistically significant. Machine vision is the measurement tool often used to provide the data for manufacturing processes.
Gauge capability should be performed on all vision systems that return a measurement as the result. An automated gauge will not be operator dependent, so the primary measures returned are the repeatability and the precision to tolerance of the gauge. To run a gauge capability, you will need a sample of parts that span the full tolerance range. Each part is measured multiple times in a random order. The variance or standard deviation of the measurements is analyzed and compared to the required gauge tolerance. Most systems are repeatable within a small operating range. Gauge capability is only demonstrated if the system is repeatable over the full tolerance range—this can be much harder to do.
Control. During the final phase of a Six Sigma project, actions are put in place to monitor and maintain the progress made during the prior three phases. SPC, Gauge Control Plans, Preventative Maintenance, and Poka Yoke or Error Proofing are the tools used for this phase.
