Hyperspectral Imaging
Remote sensing maps invasive weeds
Rand Swanson
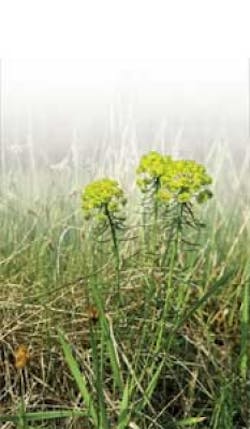
Leafy spurge is an aggressive, invasive, noxious weed that displaces native species and can reduce grazing forage by as much as 75%. It has established itself in 19 states in the US, with more than 1 million acres infested in four Northern Plains states alone. The estimated annual grazing losses are more than $26 million. Various methods have been used to try to control leafy spurge, including herbicides, mechanical removal, planting competitive grasses, intensive sheep grazing, and introducing flea beetles and their larvae to feed on the weed.
It is often difficult to monitor whether management efforts are working because leafy spurge can cover large regions that are difficult or expensive to monitor with ground-based methods. Remote sensing might be the best technique to map and detect invasive species because large tracts of land can be imaged quickly and topography, vegetation, and other ground objects do not obscure lines of sight from air- and space-borne sensors.
Hyperspectral imaging
Hyperspectral imagers, which provide tens or hundreds of narrow spectral-band measurements for each pixel, have been shown to provide accurate invasive weed detection. However, major limitations include relatively low spatial resolution from some satellite data and the high cost of use for many other sensors. This is a problem because invasive weeds can be at different growth stages at the same time in a given area, and historically hyperspectral remote sensing has been far too expensive for multiple flights to detect weeds over a range of growth stages.
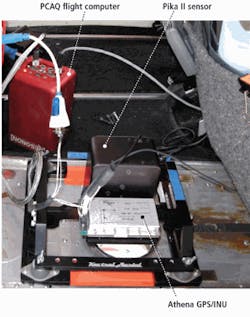
Under the direction of Rick Lawrence and Kevin Repasky, a group at Montana State University has explored the possibility of using the emerging class of inexpensive, compact hyperspectral instrumentation for remote sensing of leafy spurge. They used a hyperspectral imaging system consisting of an imaging spectrometer, global positioning system/inertial navigation unit (GPS/INU), and flight computer. The imaging spectrometer, a Pika II from Resonon, weighs 2.3 lb, has a spectral range of 400–900 nm, and was binned to provide 80 spectral channels with a 6.25-nm spectral resolution.
Hyperspectral data were stored in band-interleaved-by-pixel (.bip) format compatible with ENVI spectral image-processing software from ITT Visual Information Solutions. The GPS/INU, a Micro INS from Rockwell Collins, was Wide Area Augmentation System (WAAS)-enabled to improve the tracking accuracy of the GPS navigation and provides 0.2° pitch and roll accuracy (see Fig. 1). Hyperspectral data were transferred to a P-CAQ PC-104 format flight computer from Resonon via FireWire (1394b), and GPS/INU data were interfaced to the PC over an RS-232 serial port.
With the hyperspectral camera collecting data at 125 lines/s, the flight computer can record 1.5 h of data on its 32-Gbyte hard drive. This corresponds to hyperspectral imagery of approximately 10 square miles. The computer CPU clock was synchronized to the GPS clock and timestamps were placed on both the hyperspectral and the GPS/INU data, which were stored onboard the flight computer.
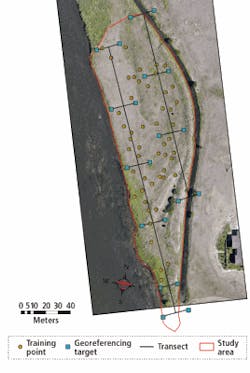
GeoReg post-processing software from Space Computer Corp uses a vector-tracing algorithm to geocorrect the hyperspectral imagery to an accuracy of approximately 20 ft. Additional first- and second-order polynomial transformations were made to match the data to known positions of multiple georeference tarps placed within the study area (see Fig. 2).
FIGURE 2. The study area was a 2.8-acre tract of land between an irrigation canal and the Madison River in Montana. Georeferencing targets (blue squares) were used as markers to improve data geocorrection. Ground truth information was obtained from 50 reference points (circles with green interior) within the study area.
The system was mounted on a custom built aluminum plate in a single-engine Cessna Skyhawk from Kestral Aerial Services and used to collect hyperspectral data over a 2.8-acre tract of land infested with leafy spurge. Flights were made at altitudes between 300 and 460 m, which provided ground sample distances between 0.2 and 0.36 m.
Data were collected during 10 flights over the study area from May 29 through August 29, 2009. “The small size of the sensor made it easy to install and remove the sensor from the plane. This and the low cost made it affordable to collect data on a near-weekly basis throughout the growing season,” reports graduate student Steven Jay.
Vegetation surveys were conducted concurrently with image collection using four 1-m2 sampling frames around 50 reference points. Results from the surveys included percent leafy spurge cover, numbers of leafy spurge stems, percent cover other species, percent dead or senesced vegetation cover, and percent cover of bare ground. Previous studies had focused on simply whether the weeds were present or not, but it is important for land managers to know the density of infestations and whether small or new patches can be accurately detected.
Image classification
For every pixel in the scene, the hyperspectral data provide a continuous spectral reflectance curve with 80 channels per curve. These hyperspectral data were classified using a machine learning technique known as random forest classification [see “Mapping invasive plants using hyper-spectral imagery and Breiman Cutler classifications (randomForest)”by Rick Lawrence, Shana Wood and Roger Sheley, Remote Sensing of Environment: Volume 100, Issue 3, pp. 356–362; Feb. 15, 2006; http://remotesensing.montana.edu/pdfs/lawrence_et_al_2006.pdf] and “Random Forests,” Leo Breiman, Machine Learning, Vol. 45, No. 1, pp. 5–32, October 2001; www.springerlink.com/content/u0p06167n6173512/fulltext.pdf].
This approach uses multiple classification trees, each based on a random subset of training data observations. Each classification tree split is based on a random subset of the spectral information from the hyperspectral data. Multiple classification trees then “vote” on the correct classification.
Random forest classification is thought to be powerful when there are many weak explanatory variables, as is the case when none of the 80 hyperspectral channels alone could be used to distinguish between leafy spurge and other materials in the scene. Additionally, the random forest classification algorithm is robust to over-fitting and provides a nonbiased internal error estimate, which allows the entire data set to be analyzed.
Estimating accuracy
Classification accuracies ranged between 73% and 90%. These classification accuracies were similar to the best seen in other studies, with the exception that other studies with similar high accuracies were simply performing detection, whereas this project successfully estimated the amount of leafy spurge cover within percentage classes. The ability to estimate cover amounts enables more accurate monitoring of plant spread and dynamics, which will lead to improved management.
Using the data collected from 10 flights resulted in a classification accuracy greater than 96%. “The significant increase in classification accuracy obtained by classifying multiple sets of imagery was a direct result of the fact that we could afford to fly the system almost every week throughout the growing season,” notes Lawrence. High-end airborne hyperspectral imaging systems such as NASA’s Airborne Visible Infrared Imaging Spectrometer (AVIRIS) are generally scheduled months to a year in advance and the cost is on the order of thousands to tens of thousands of dollars to collect a single data set.
Only recently have breakthroughs in high spatial and spectral resolution hyperspectral imaging made the technology compact, reliable, and affordable for remote sensing applications. The work performed by those at Montana State University provides a foundation for detecting multiple plant species, monitoring seasonal changes, and identifying plant stress.
“We’ve thought for years that hyperspectral remote sensing has had immense potential,” says Lawrence. “Now it is becoming cost effective to use on an operational basis rather than just as a research tool.” In addition to invasive weed studies, future plans include using the system to monitor stress induced by controlled carbon-dioxide leaks from an underground pipeline.
Acknowledgment
Funding for this work was provided by the Montana Board of Research & Commercialization Technology.
Rand Swanson is co-founder of Resonon (Bozeman, MT, USA; www.resonon.com).
Company Info
ITT Visual Information Solutions
Boulder, CO, USA
www.ittvis.com
Kestral Aerial Services
Bozeman, MT, USA
www.kestrelaerial.com
Montana State University
Bozeman, MT, USA
www.montana.edu
Resonon
Bozeman, MT, USA
www.resonon.com
Rockwell Collins
Cedar Rapids, IA, USA
www.rockwellcollins.com
Space Computer Corp.
Los Angeles, CA, USA
www.spacecomputer.com


