Digitizing eye motion makes motion sickness measureable
Digitizing eye motion makes motion sickness measureable
By Shari Worthington, Contributing Editor
Acceleration of the human body affects the way the microscopic calcium crystals in the inner ear bend some 20,000 sensing fibers. Under normal gravity, these fibers are bent by the weight of the crystals. This arrangement helps the brain determine which way the body is oriented. Under weightless conditions, these crystals are not weighed down, and the brain receives signals from the ear that conflict with visual cues. This results in feelings of nausea or motion sickness.
Space motion sickness has symptoms similar to motion sickness on Earth and has affected 50%--70% of astronauts. Consequently, NASA is trying to eliminate space motion sickness and improve astronaut comfort. To do so, Nicolas Groleau, formerly at NASA Ames Research Center (Moffett Field, CA) and now engineering project manager at Octel Communications Corp. (Milpitas, CA), has studied the relationship between sensors in the ear and human vision to determine how the body interprets such information under weightless conditions.
To understand how the motion of the eye is affected by weightlessness, eye motion under such conditions must be measured. However, tracking visual features such as parts of the retina or blood vessels is difficult due to their low contrast. Therefore, to analyze the motion of the eye under these conditions, astronauts are shown a rotating visual stimulus that the eye follows or attempts to follow.
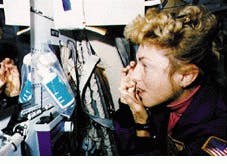
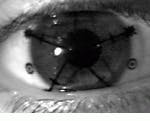
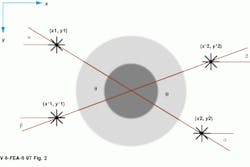
To automate data collection, soft, transparent contact lenses are first placed over the astronauts` eyes (see Fig. 1). These contact lenses have specially constructed fiducial marks on them that are used to determine the position of the eye. Eye motion is then determined by comparing how the fiducial marks on the contact lens move under different weightless conditions (see Fig. 2).
Using a CCD camera, Groleau`s system locates two fiducials on the contact lenses and checks how they move from a stationary, beginning position. Once this calculation is performed, elementary trigonometry yields the angle of rotation of the eye from the reference image.
To distinguish the fiducials from their background, images are first digitized using a Macintosh-based 8-bit frame-grabber video digitizing board from Neotech (Hampshire, England). Using LabVIEW software from National Instruments (Austin, TX), a thresholding and center-of-gravity algorithm is used to distinguish the fiducial reference marks from the image background.
Rotation angle
After the images have been captured and processed, they are stored on videotape. After each frame is captured, the Neotech frame grabber sequentially advances a VCR frame by frame to store up to 20 seconds of image data. Control of the VCR is performed by LabVIEW software.
After image processing and data analysis, the system produces a time series of the angle of rotation of the eye from the reference image. Additionally, vertical and horizontal displacements are measured. But because the vertical signal is unusable in its raw form due to vertical video jitter from odd to even frames, additional marks on the astronauts` foreheads are used to reference captured images and head movement. In this way, jitter can be removed from the resulting vertical displacement data.
Angle of rotation of each video frame is saved on disk in either ASCII or binary format and processed at one frame per second using LabVIEW software. Because Groleau`s system is 10 times faster than earlier systems developed at MIT Lincoln Laboratory (Bedford, MA), faster analysis of rotational eye movements and their correlation to motion sickness can be made. Despite this, a typical 20-s video segment of data still requires 10 min to analyze. Therefore, NASA is looking to analyze video images in batch mode. To do so, an operator would preselect video segments and concatenate many 10-minute analysis sessions in a longer computation session.
Groleau ([email protected]) admits that his research is just the beginning of further work that may provide information for selection and training of astronauts. "As yet," he says, "such findings cannot be used to prove whether particular people will be more susceptible to space motion sickness. As such, the data cannot be used to preselect people that may be more suitable for space flight." Despite this, data gathered from such experiments may be of use in medicine, where doctors need to control perception and motion disorders, such as the vertigo associated with Meniere`s disease.
Since the experiments developed by Groleau, more-recent shuttle missions have featured an enhanced version of the experiment that uses neck angle receptors. A subject looks into the dome and, with a joy stick, indicates the direction of perceived motion. Eye and body movements are recorded on video tape, and a strain gauge measures neck movement. Crew members wear accelerometers and tape recorders that measure head movements. By correlating the accelerometer data and reports of symptoms, investigators can study the relationship between provocative head movements and periods of discomfort.
FURTHER READING
N. Groleau, "NASTASSIA: A video-based image processing system for torsional eye movements analysis," Proc. 13th Annual International Conference IEEE Engineering in Medicine and Biology Society, Orlando, FL (Oct. 1991).
D. J. Newman, "Human locomotion and energetics in simulated partial gravity," unpublished Ph.D. thesis, Dept. of Aeronautics and Astronautics, Massachusetts Institute of Technology, Cambridge, MA (June 1992).
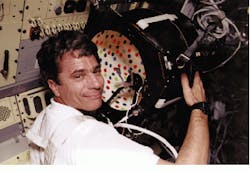
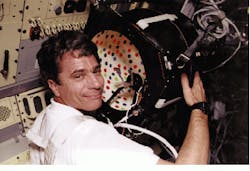
Commander John Blaha is preparing for a test of eye movement under zero gravity aboard the Columbia space lab. Eye movements are studied to determine how conflicting information between inner ear signals, visual cues, and other sensory cues contributes to space motion sickness.
FIGURE 1. Payload Specialist Millie Hughes-Fulford inserts a specialized contact lens into her eye while on the mid-deck of the Columbia space shuttle. Such contact lenses allow eye movements to be captured using a Macintosh-based frame grabber.
FIGURE 2. To automate data collection, contact lenses have specially engraved fiducial marks. These are used to determine the position of the eye and how it has moved away from a pre-determined reference position under zero-gravity conditions.
Walking under water helps researchers simulate space
To design the next generation of space-suit life-support systems, better gravitational simulation methods are required. By studying how human beings walk in simulated partial gravity levels, researchers can better understand the parameters involved in space-suit design. To do so, five gravity conditions were simulated in NASA`s Neutral Buoyancy Test Facility (NBTF) using different simulated gravity levels. To collect data from astronauts under water, Nicolas Groleau integrated a Mac II-based data-collection and analysis system using the MacADIOS II data-acquisition I/O board from GW Instruments (Somerville, MA). The data-acquisition board plugs into the Mac II NuBus backplane and connects a series of field sensors to a subject and a submersible treadmill.
The submersible treadmill features a split-plate force platform that measures force through a split-platform design embedded under the treadmill belt. This setup detects when both feet are not on the treadmill at the same time and provides analysis of subjects walking or running.
A Sony 8-mm video camera records the subject`s locomotion in two dimensions, allowing visual confirmation of the force traces from the embedded split-plate. Gait analysis is calculated from these force traces using MatLab from The MathWorks (Natick, MA) and Kaleidagraph from Synergy Software (Reading, PA). Data collected include peak force, stride frequency, contact time, and the angle of the legs. Vertical velocity is calculated by integrating the force profile over the stride cycle.
During the experiments, subjects wear diving masks. LabVIEW software records force traces from the submersible treadmill, samples gas concentrations from the subject`s expired air, and calculates the flow rate of expired air.
Once the gait used by the subject is constant, oxygen and carbon dioxide flows are measured once every 10 s. Four strain gauges located at each corner of the force plate are sampled at 1000 Hz for 10 s. The treadmill front panel displays the load, average force, oxygen consumption, and carbon monoxide and oxygen flow rates. The front panel also allows the operator to select the program mode, set the duration of force rate, and gas-analysis sampling.
Once all the data have been collected, they are analyzed so that NASA engineers can understand which parameters are most important in space-suit design. For instance, by analyzing how people move under different energy levels and how they expend energy in different gravity levels, one can determine preferred mixtures of oxygen and carbon dioxide in space-suit life-support systems.
S. W.
