Opto-acoustic imaging and ultrasound team up for breast cancer analysis
Combining opto-acoustic imaging with conventional ultrasound techniques allows radiologists to more accurately classify breast tumors.
According to the World Health Organization (WHO, Geneva, Switzerland; www.who.int) over half a million women died in 2015 due to breast cancer. Although breast cancer can be discovered when symptoms may appear, many women will have no symptoms, making regular screenings important.
To date, there have been a number of different imaging methods to both detect and diagnose breast cancer. These include X-ray-based mammography, ultrasound to detect changes in breast tissue such as lumps, magnetic resonance imaging (MRI) to measure the size of the cancer and newer techniques such as molecular breast imaging (MBI), positron emission mammography (PEM), electrical impedance imaging (EIT)) and elastography. A brief description of these various techniques can be found on the website of the American Cancer Society (Atlanta, GA, USA; www.cancer.org) at http://bit.ly/VSD-BIT.
Adding optics
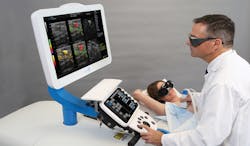
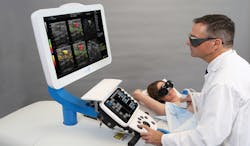
Of these newer techniques, an opto-acoustic technique realized by Seno Medical Instruments (San Antonio, TX, USA: www.senomedical.com) in its Imagio Breast Imaging System leverages opto-acoustic technology with ultrasound to generate functional and anatomical images of the breast (Figure 1). Using this combined opto-acoustic and ultrasound technique, the system can more effectively aid radiologists in diagnosing malignancies without exposing patients to either X-rays or contrast agents used in other imaging techniques. The technology is the subject of a U.S. PMA filing with the FDA and does have European CE Mark.
Figure 1: An opto-acoustic technique realized by Seno Medical Instruments in its Imagio™ Breast Imaging System fuses opto-acoustic technology with ultrasound to generate functional and anatomical images of the breast.
Indeed, in a study from the Department of Radiology and Nuclear Medicine of the University Medical Centre (Utrecht, the Netherlands; www.umcutrecht.nl), Dr. Gisela Menezes and her colleagues found that the system facilitates the distinction between benign and malignant masses, potentially decreasing the need for both biopsies and short-interval follow-up imaging examinations (see “Downgrading of Breast Masses Suspicious for Cancer by Using Optoacoustic Breast Imaging,” http://bit.ly/VSD-BMS).
“In standard ultrasound systems,” says Steve Miller, Senior Vice President of Engineering with Seno Medical Instruments, “a linear phased array ultrasound transducer is used to sequentially image relatively small areas as the transducer is swept over the breast. The reflected signals are then filtered and the resulting data composed as an image that is often pseudo-colored to highlight specific features within the image.”
Ultrasonic methods
However, to show the morphological structure of the breast tissue as well as functional information such as the relative degrees of oxygenation of the blood vessels within, a fusion of opto-acoustic and ultrasound is required. Determining the relative levels of oxygenation and blood supply can aid cancer detection since cancerous tissue will trigger the formation of blood vessels in tumor tissue (neoangiogenesis) and consume oxygen at higher rates from the arteries and return more de-oxygenated blood through the veins.
Thus, by combining both an ultrasound technique to visualize morphological structures and an opto-acoustic technique, the radiologist can more easily differentiate between benign and malignant masses.
To generate the ultrasound images in the Imagio imaging system, ultrasound is transmitted through the patient’s body and, whenever it encounters two adjacent tissue types with different acoustic properties, some of the ultrasound energy is reflected. This amount of energy depends on the density of the material and the speed at which ultrasound passes through it. By then calculating the distances from the ultrasonic probe to the adjacent tissue types and measuring the intensity of the returned signal, distances and intensities can be displayed as a two-dimensional image.
In the design of the Imagio imaging system, a phased array ultrasound transducer is used to generate short-pulse wavelengths of 6-12MHz. Consisting of 128 x 1 elements, the transducer captures reflected signals from underlying tissue that are then digitized by several Analog Front Ends (AFEs).
Each AFE consist of processing elements that are applied to each of the 128 channels. These include a low-noise pre-amplifier, a time-varying gain amplifier that compensates for attenuation of the returning signal as a function of time, an antialiasing filter and a 14-bit Analog-to-Digital Converter (ADC).
To allow a single, linear 128 x 1 ultrasound transducer to capture data from different depths across a 4cm2 area, both electronic beam forming and mechanical beam forming techniques are used. A description of these techniques and how they can be applied can be found on the website at http://bit.ly/VSD-TUP. Before the captured, processed and digitized ultrasonic signals can be displayed however, they are bandpass filtered on the system’s host PC to reduce noise outside frequencies of interest.
Anatomical and functional
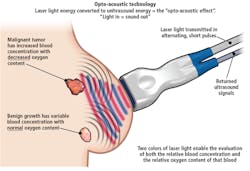
While the Imagio imaging system uses conventional methods to generate ultrasonic images, its advantage over such methods is that it fuses this technology with opto-acoustic imaging, allowing ultrasound images, opto-acoustic images or a combination of both to reveal anatomical and functional images of breast tissue (Figure 2).
Figure 2: While the Imagio imaging system uses conventional methods to generate ultrasonic images, it fuses this technology with optoacoustic imaging, allowing ultrasound images and opto-acoustic images co-registered with ultrasound to reveal anatomical and functional information of the breast tissue in and around the mass.
To perform opto-acoustic imaging, laser light is transmitted into the breast from the same handheld probe that contains the ultrasound transducer. This laser light is transmitted at wavelengths of 757nm and 1064nm.
Energy from the laser light is then absorbed by hemoglobin in the arteries and veins of the breast. As it is absorbed, the blood becomes warmer and briefly thermoelastically expands, producing an ultrasonic frequency that is then detected by the ultrasonic transducer in the probe.
Since the 757nm wavelength is absorbed relatively more by de-oxygenated hemoglobin (that may be returning from a vein) and the 1064nm wavelength is absorbed relatively more by oxygenated hemoglobin (from an artery), the data captured by the ultrasound probe can be used to produce functional information such as the relative oxygenation state of arteries and veins that may be surrounding a tumor. To produce the laser light used at these both of these two wavelengths, no standard or custom off-the-shelf laser could be found. Instead, engineers at Seno Medical Instruments designed and built a custom dual-wavelength laser head to generate both the 757nm and 1064nm light required. By using time-division multiplexing, these two wavelengths at 5 pulses per second per wavelength, a single optical fiber bundle approximately 2m in length can transmit the light to the tip of the probe. Two optical windows placed on either side of the output of the fiber bundle ensures that light transmitted is both even and symmetric. To capture data from the returned signal, the ultrasound transducer is switched at 10Hz such that ultrasound images generated by both ultrasound and opto-acoustic modalities can be captured. To process these data returned ultrasound signals from the opto-acoustic system, a second set of AFEs are employed. Here, Intel Integrated Performance Primitives from Intel (Santa Clara, CA, USA; www.intel.com) were used to band-pass filter the captured opto-acoustic data.
Image processing
Since the Imagio imaging system is designed to display both ultrasound images and greyscale ultrasound images with fused opto-acoustic data, the opto-acoustic signal must first be color-coded, co-registered and interleaved with the greyscale ultrasound image to produce images that reveal the relative oxygenation and de-oxygenation present.
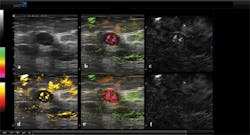
This post-processing, as well as image segmentation tasks such as thresholding, were performed using an embedded GPU from NVIDIA (Santa Clara, CA, USA; www.nvidia.com) programmed in CUDA. Results of this processing are then transmitted through the DVI port of the host PC and displayed on a 23-in medical grade 1920 x 1200 In-Plane Switching (IPS) LCD monitor, with six images being displayed on the screen (Figure 3).
Figure 3: (a) A greyscale ultrasound image, (b) a combined ultrasound and opto-acoustic image with oxygenated blood (green) and de-oxygenated hemoglobin (red), (c) data captured after tissue is subjected to reflected 757nm laser light shows deoxygenated hemoglobin, (d) a segmented opto-acoustic total hemoglobin image with total hemoglobin displayed in yellow, (e) a non-segmented, opto-acoustic image with oxygenated blood in green and relatively de-oxygenated blood in red, and (f) reflected 1064nm laser light shows oxygenated blood.
In this panel of images, abnormal cells have been found in the lining of the breast milk duct and the areas that produce milk (lobules). While Figure 3a shows a standard greyscale ultrasound image, Figure 3b displays a combined ultrasound and opto-acoustic map. This is pseudo-colored to show relatively oxygenated blood as green and relatively de-oxygenated blood as red and has been thresholded to minimize the colorization of the surrounding tissues.
To show the relatively more de-oxygenated hemoglobin, Figure 3c displays the results of data captured after the tissue is subjected to 757nm laser light while Figure 3f is the result of data captured after being subjected to the 1064nm laser light and shows more relatively oxygenated blood. Finally, Figure 3d shows a segmented opto-acoustic total haemoglobin image with total hemoglobin displayed in yellow while Figure 3e is a non-segmented opto-acoustic image that shows oxygenated blood in green and relatively de-oxygenated blood in red and is not subjected to a threshold. Segmentation lines manually drawn on the ultrasound image were used to co-register locations on the five opto-acoustic images to highlight the opto-acoustic results.
While the greyscale ultrasound image can identify the morphological features of the tissue, the relative degree of oxygenation or de-oxygenation of the vessels representing functional information can be seen in both the overlaid ultrasound and opto-acoustic images as well as the opto-acoustic images alone.
Adding this functional information to morphologic information can then aid radiologists in differentiating between benign and malignant masses. At the same time, the Imagio imaging system can potentially reduce the false-positive findings and biopsies that are typically associated with more conventional methods.
Companies mentioned
American Cancer Society
Atlanta, GA, USA
Intel
Santa Clara, CA, USA
NVIDIA
Santa Clara, CA, USA
Seno Medical Instruments
San Antonio, TX, USA
University Medical Centre
Utrecht, the Netherlands
About the Author

Andy Wilson
Founding Editor
Founding editor of Vision Systems Design. Industry authority and author of thousands of technical articles on image processing, machine vision, and computer science.
B.Sc., Warwick University
Tel: 603-891-9115
Fax: 603-891-9297


