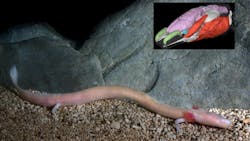
3D Imaging Aids Research on Blind Cave Salamander Adaptation
In an article titled "Living in darkness: Exploring adaptation of Proteus anguinus in 3 dimensions by X-ray imaging” published by GigaScience, authors Markéta Tesařová and Lucia Mancini describe how researchers used contrast-enhanced X-ray computed microtomography (microCT) for the 3D segmentation of the soft tissues in the head of P. anguinus (cave-dwelling salamander) and A. mexicanum (tiger salamander). Sensory organs were visualized to learn how the blind cave salamander is adapted to living in complete darkness.
The research entailed providing X-ray microCT datasets along with 3D models for larval, juvenile, and adult specimens that showed the cartilage of the chondrocranium and the position, shape, and size of the brain, eyes, and olfactory epithelium, according to the article.
Researcers used a GE Phoenix v|tome|x L 240 laboratory X-ray microCT system from Waygate Technologies/Baker Hughes Digital Solutions GmbH, (Wunstorf, Germany; www.bakerhughesds.com/waygate-technologies) to scan the salamanders’ head regions, according to the article. The system comprised a 180-kV/15 W maximum power nanofocus X-ray tube and a high-contrast flat-panel detector DXR250 with 2,048 × 2,048 pixel resolution and 200 × 200 μm2 pixel size. The article states that a 2,000 projections over a total scan angle of 360° were acquired with an exposure time of 900 ms per projection. Each projection was captured three times, and an average of the signal was used to improve the signal-to-noise ratio.
To complete tomographic processing, researchers used GE phoenix datos|x 2.0 software, again from Waygate Technologies/Baker Hughes Digital Solutions GmbH. A segmentation procedure was then applied to reconstructed slices. Thermo Fisher Scientific’s (Waltham, MA, USA; www.thermofisher.com) Avizo 7.1 image processing software was used for semiautomatic segmentation of structures in the head. To reduce the load of the 3D segmentation volume, every third slice was manually segmented, and the rest was calculated by linear interpolation between manually segmented slices. Researchers converted the semi-manually segmented models into polygonal meshes and imported the results using VG Studio MAX 2.2 software from Volume Graphics GmbH (Heidelberg, Germany; www.volumegraphics.com) for 3D visualizations.
